


Conventional AVO indicators, such The product of intercept (A) and gradient (B) is a commonly used AVO attribute for identifying low-impedance sand layers embedded within higher-impedance shale, typical of Class III AVO anomalies. However, this indicator can lose discriminating power in situations where reflection amplitudes are strongly influenced by factors such as gas saturation, thin-bed tuning, or sharp lithologic contrasts. In such cases, the A×B attribute may not reliably separate true Class III responses from other high-amplitude effects. This study introduces a frequency-domain extension of the AB attribute, supported by two diagnostic measures – the Consistency Index and the slope of AB with frequency – to discriminate between fluid and lithologic responses. Synthetic modeling, well calibration and field application demonstrate that the proposed workflow provides a practical and quantitative framework for reducing AVO interpretation ambiguity.
Amplitude variation with offset (AVO) is a foundational technique in quantitative seismic interpretation, with Class III anomalies, defined by a negative intercept and a strong negative gradient, commonly linked with gas sands. Among the various AVO-derived attributes, the product of intercept (A) and gradient (B), known as the AB product, has proven particularly effective for delineating hydrocarbonbearing sands. For AVO classes and the definitions of intercept and gradient, please see the June 1999 installment of Geophysical Corner.
However, in many cases, similar responses arise from lithologic contrasts, thin-bed tuning or coal layers, leading to false hydrocarbon indications. Consequently, relying solely on conventional broadband AB analysis can lead to ambiguity in distinguishing true hydrocarbon anomalies from lithology- or coal-related effects.
Case Study
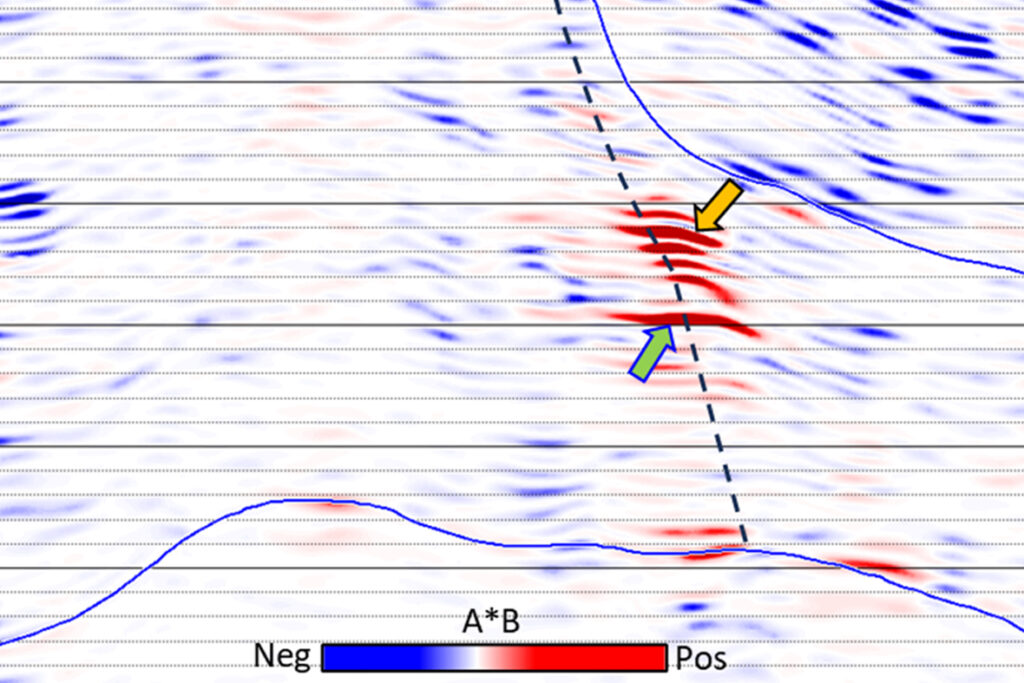
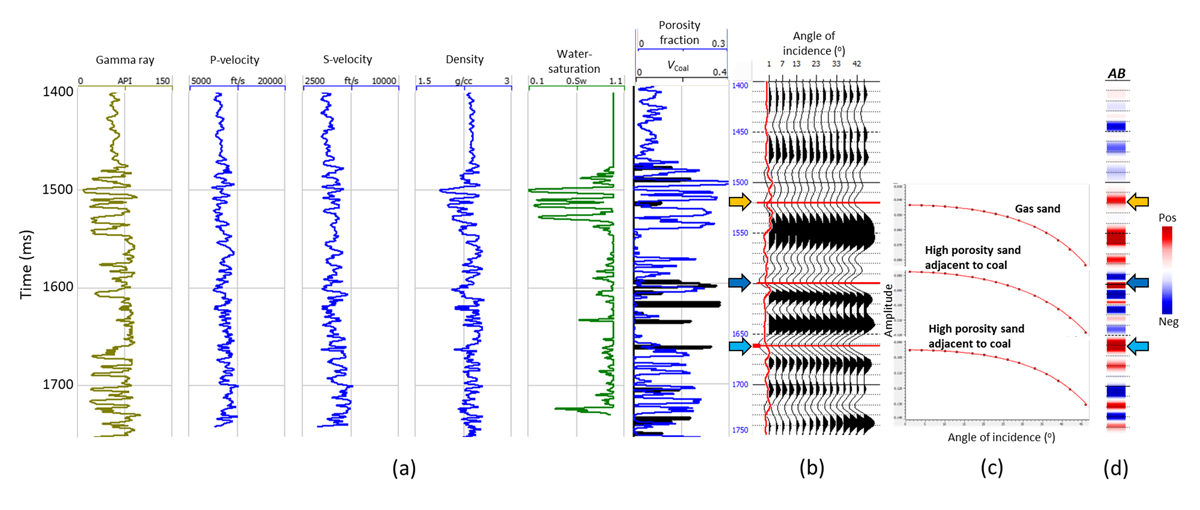
In our study area, such ambiguity was evident at Well A where hydrocarbon bearing sand as well as high-porosity brine sands adjacent to coal exhibited strong Class III AB anomalies as shown in figure 1. Synthetic modeling confirmed that differences in P- and S-wave velocities and Poisson’s ratio can yield similar AVO responses even for distinct lithologies and fluids. However, these scenarios exhibit contrasting distinct frequencydependent behavior: hydrocarbon-related attenuation produces a smooth decay of higher frequencies, whereas thin-bed tuning and coal layers introduce frequencyselective amplification or oscillations. By extending AB analysis into the frequency domain, these subtle differences can be exploited to resolve ambiguities and improve lithology–fluid discrimination, as demonstrated in prior studies using spectral decomposition of AVO attributes. Building on these foundations, we propose a simple, interpretable frequency-domain AB workflow using CI and slope as frequency-based diagnostics.
Methodology
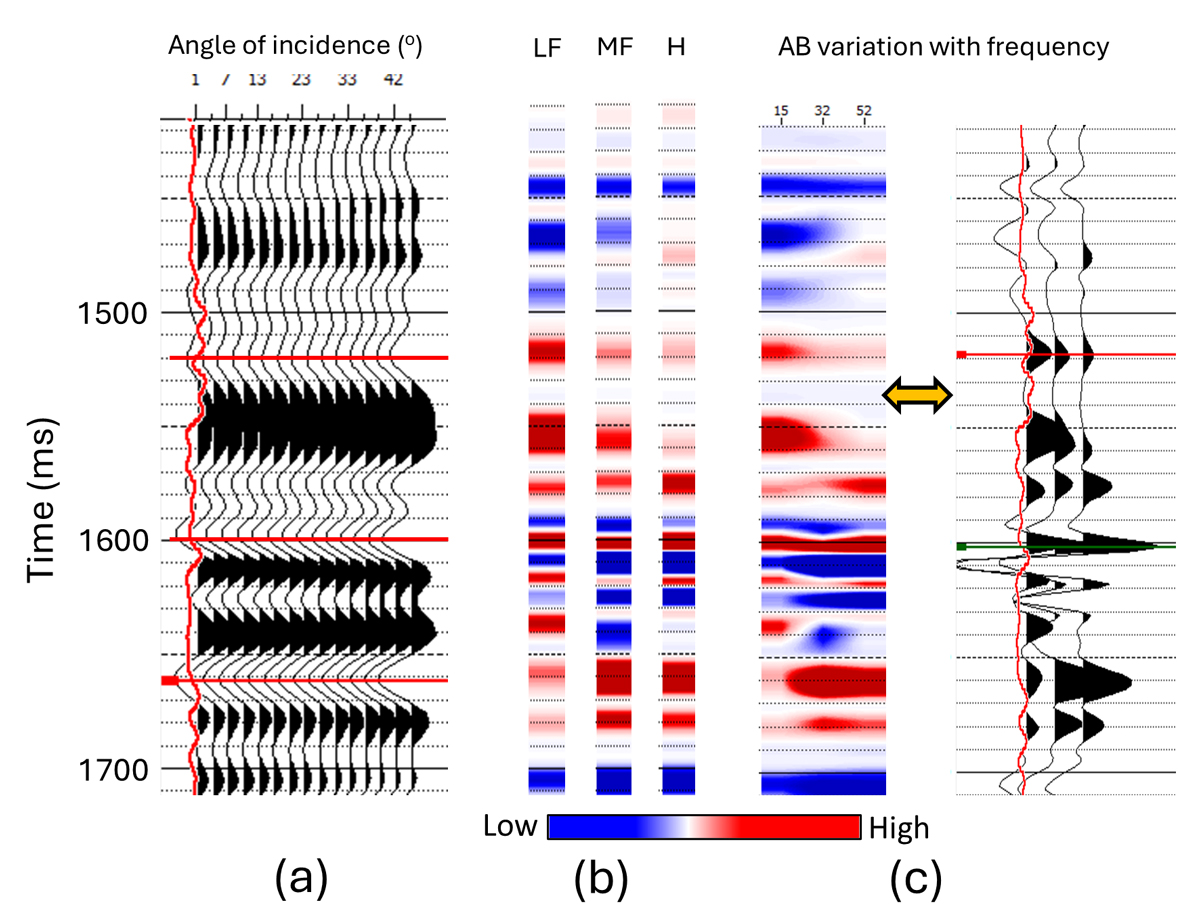
Frequency-Domain AB Computation: Angle stacks were decomposed into multiple narrow frequency bands using spectral decomposition. The Aki–Richards two-term linearized equation was fitted within each band to estimate intercept (A) and gradient (B), from which the AB product was computed.
Diagnostic Attributes: Two attributes were derived from the frequency-dependent AB spectrum at each time sample:
- Consistency Index (CI): Quantifies the smoothness or irregularity of AB variation with frequency. Low CI implies consistent decay; high CI indicates spectral oscillations or tuning effects.
- Slope: Measures the trend of AB amplitude versus frequency. Negative slopes correspond to attenuation dominated (fluid-related) behavior; positive slopes indicate amplification or interference.
These metrics provide a compact summary of spectral AB behavior and serve as frequency-domain discriminators.
Application to Well Control
At Well A, for gas-bearing sands, AB amplitude decreased smoothly with frequency, consistent with hydrocarbonrelated attenuation. In contrast, for brine sands near coal frequency amplification due to interference from coal reflectivity was noticed as shown in figure 2. Notably, when analyzed solely in the angle domain, both intervals appear nearly identical as Class III anomalies (figure 2e). Thus, frequencydomain analysis effectively resolves the ambiguity inherent in broadband AVO, providing a more reliable basis for interpretation.
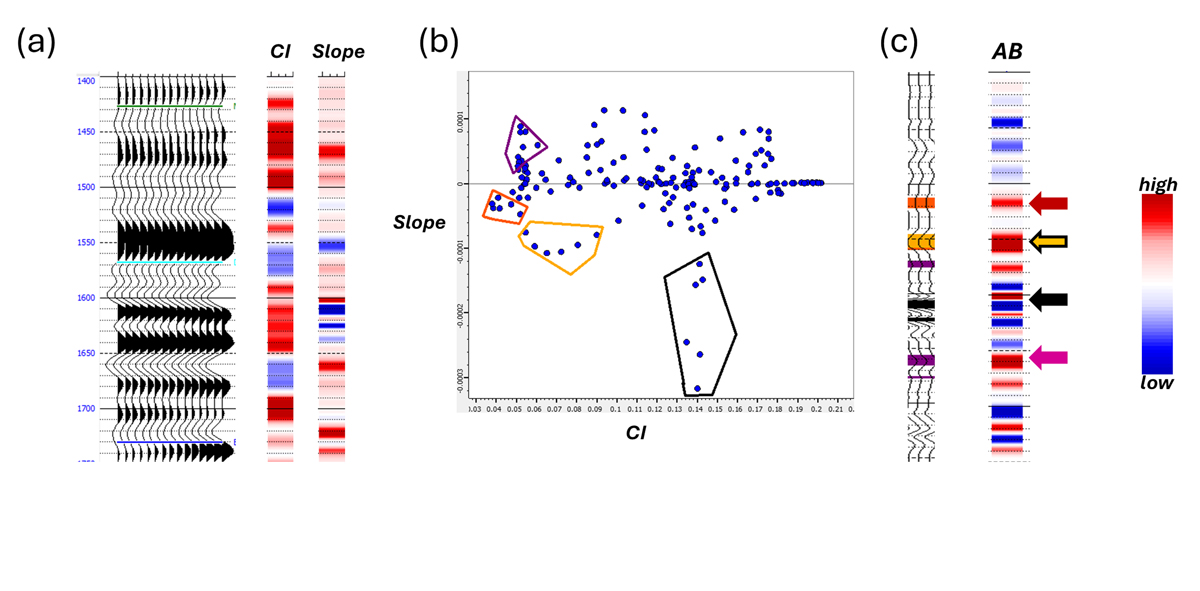
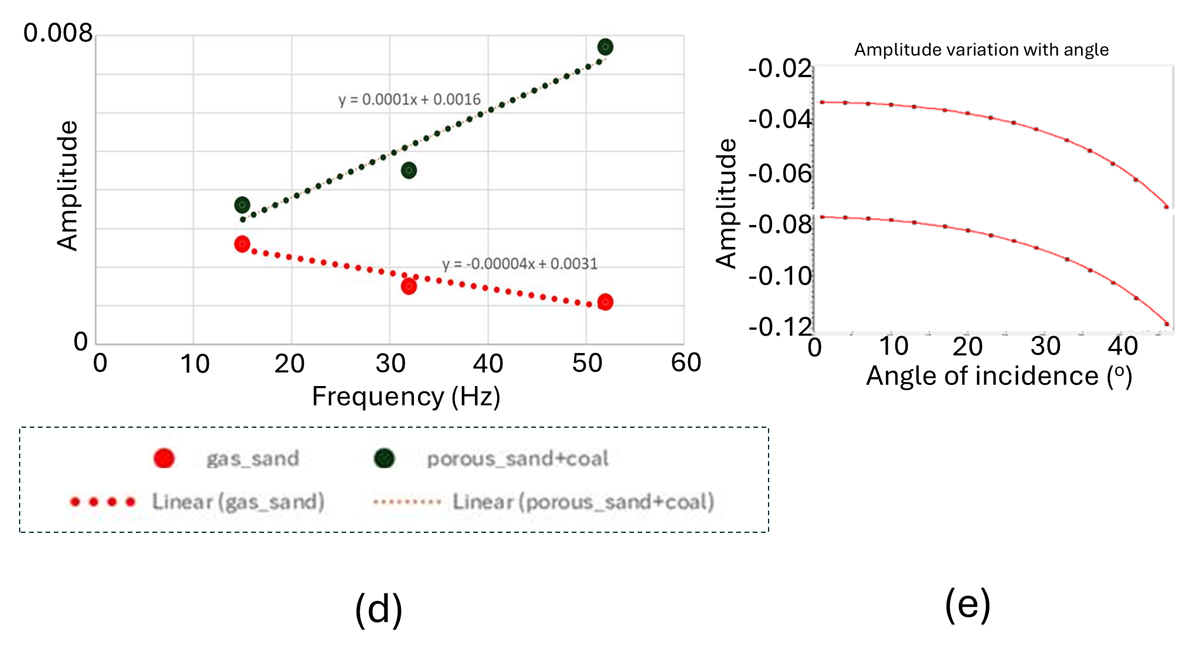
These differences are further quantified using the proposed diagnostic attributes. The gas-sand interval shows a smooth decay pattern, corresponding to a low-tomoderate CI and a gently negative slope of AB versus frequency. In contrast, the brine– coal interval exhibits irregular frequency amplification, resulting in a high CI and a strongly positive slope (figure 3a). The discriminative power of these attributes is highlighted in a CI–slope crossplot (figure 3b), where hydrocarbon-bearing sands, brine sands, and coal clusters occupy distinct regions. Back-projection onto the seismic section (figure 3c) confirms their spatial correlation, demonstrating that Class III anomalies identified in broadband analysis can now be reliably distinguished according to their true fluid or lithologic origins.
This outcome highlights the effectiveness of the proposed frequencydomain AB workflow, providing a more robust interpretational framework and enhanced confidence in differentiating hydrocarbons from lithology- and tuningrelated responses.
Application to Seismic Data
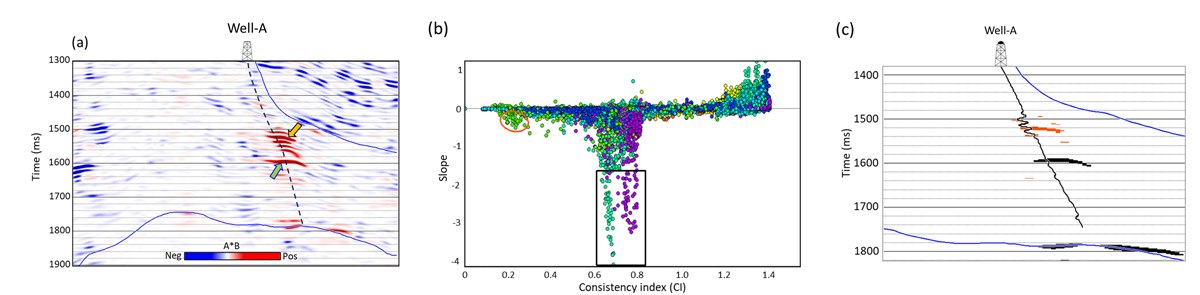
On the full-band AB section, multiple strong Class III anomalies were observed around Well A as shown in figure 4(a). When decomposed into frequency bands, the anomalies exhibited contrasting spectral behaviors:
- Hydrocarbon-related event: smooth decay of AB amplitude with frequency (low CI, negative slope)
- Lithologic/tuning-related event: irregular or oscillatory AB variation (high CI, large slope)
Crossplotting CI and slope (figure 4b) allowed classification of seismic samples into hydrocarbonprone or lithology-dominated clusters. Back-projection of these clusters onto the seismic section (figure 4c) showed excellent spatial correspondence with the known geology – confirming hydrocarbons at upper interval and high porosity brine sand adjacent to coal at lower interval as expected.
Conclusions
Extending AB analysis into the frequency domain illustrates its potential to resolve ambiguity of Class III AVO interpretation. The CI and slope provide a compact and quantitative means of characterizing spectral AB behavior, distinguishing true fluid attenuation (low CI, negative slope) from tuning or lithologic amplification (high CI, large slope). The method preserves the simplicity of the AB product while adding frequencybased discrimination power. It requires only standard spectral decomposition and linear AVO fitting – making it computationally efficient and easily deployable within existing interpretation workflows. Attribute stability depends on spectral balancing and signalto-noise ratio at higher frequencies, emphasizing the need for well calibration and careful data conditioning. Future extensions may include 3-D implementation, probabilistic rock-physics integration, and machine learning classification of CI–slope clusters. Overall, the frequency-domain AB workflow offers a practical and interpretable tool for improving hydrocarbon detection confidence in challenging Class III environments.