

Pockmarks are prominent features seen on seafloors worldwide in different depositional environments, including continental shelves, slopes and ocean basins.
Early observations of methane gas bubbles and oil slicks on the surface of the sea led people to believe that seepage of hydrocarbons from the seafloor was taking place. Later, continuous profiling with high-resolution seismic reflection systems and side-scan sonars in hydrocarbon development areas showed the pockmarks to be indeed associated with hydrocarbon seepages.
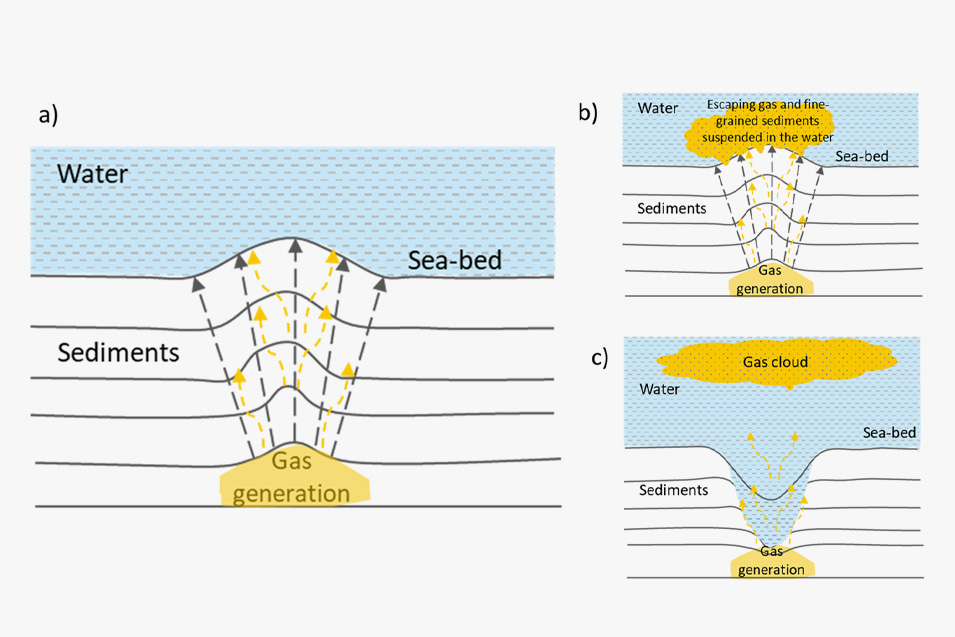
The pockmarks generally form in soft, fine-grained sediments, such as clays, muds and silts. The mechanism for formation of pockmarks is understood to take place in stages. When the migrating gas, for example, approaches the seabed, the excess pore fluid pressure pushes the overlying sediments, making them bulge upward (figure 1a). Continued upward pressure sees the release of gas from the sediments into the water column. The escaping gas carries fine-grained sediments into suspension, after which they drift away with the underwater currents (figure 1b). As these fine-grained particles are winnowed from the shallow sediments, the coarser-grained particles fall back to the seabed. Depressions start forming at the initial gas-escape locations, and with sufficient time take the shape of pockmarks (figure 1c). A similar mechanism explains the escape of oil from the pockmarks.
Pockmarks have been reported in the North Sea, offshore West Africa, the eastern coast of Canada, offshore New Zealand and many other places. The size of the pockmarks is variable, with finer seafloor sediments facilitating larger pockmarks with diameters up to 1,000 meters and depths up to 25 meters.
The escaping fluids follow a migration route in the subsurface. Sometimes this is simply biogenic gas escaping through porous and permeable sediments. Other times there is structural and stratigraphic control, with gas migrating upward along permeable faults or following zones of weakness associated with differential compaction over deeper gas-charged channels.
Seismic Identifiers
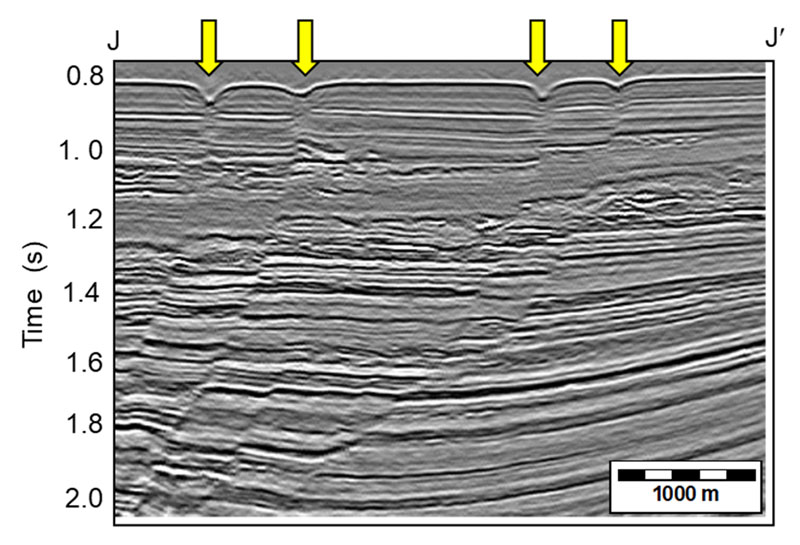
Figure 2 shows the pockmarks on a vertical section, which are fault controlled. In this case the fault is seen to be propagating to the surface. Interestingly, it is worth noting that many of the layers adjacent to the fault suffer a velocity pushdown and have strong amplitudes, which implies they are gas charged.
Some pockmarks are seen to be uncorrelated to the underlying stratigraphy or structure, suggesting that the fluids that formed them originated at a shallower depth.
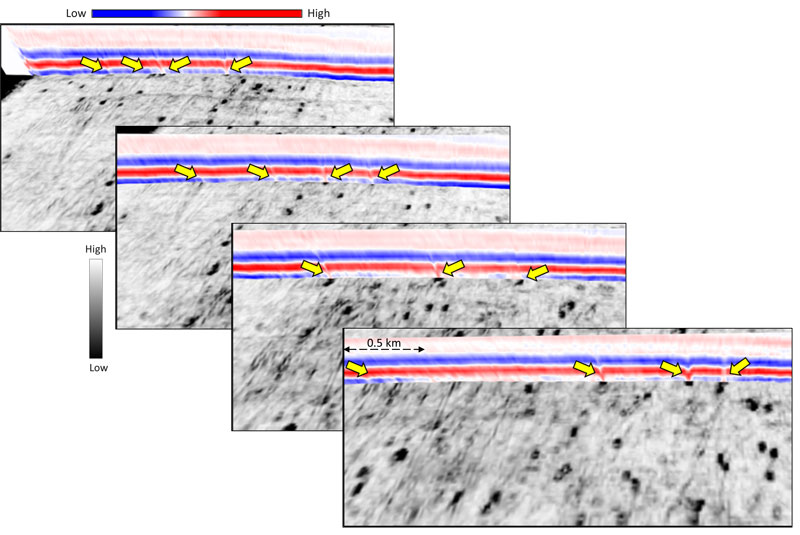
Figure 3 shows a succession of chair displays with the vertical seismic inline sections, intersecting the horizontal energy ratio coherence attribute stratal slices a few milliseconds below the sea floor. The sea floor is indicated by the red peak on the seismic section. Notice the pockmarks in black seen on the coherence displays show their corresponding seismic signature on the seismic amplitudes. The data is from the Smeaheia area located east of the Troll field in northern North Sea.
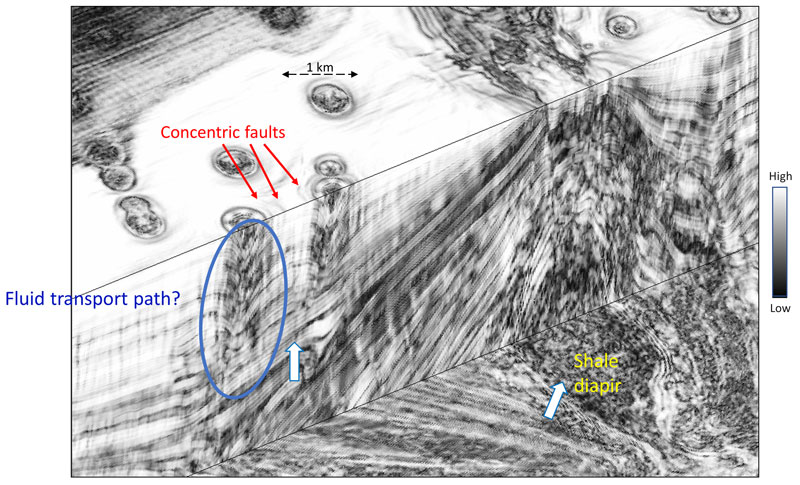
Figure 4 shows a close-up of the pockmarks seen on the sea floor in west Africa. The radial patterns seen on some of the circular features approach 750 meters in diameter. Concentric rings around some of the features suggest collapse as the gas and fluid escape. More coherent rings appear at a greater radius, where the sediments are flat, leading us to believe that these ring features are structural rather than artifacts of the computation wherever we encounter steep dips. Some of these pockmarks appear to be controlled by faults. The faults in turn appear to be controlled by shale diapirism.
As stated above, once the gas reaches the seafloor it expands, carrying shallow mud up into the water column where it can be carried away and dissipated by currents running along the sea floor. Such pockmarks often form the locus of unique chemosynthetic biological communities living on the dark ocean floor and might form small carbonate buildups. Because of their biological uniqueness, such communities are protected in many national waters.
Because they are caused by gas seeping into the shallow section, pockmarks can indicate potential drilling hazards, where the drilling team should take appropriate precautions.
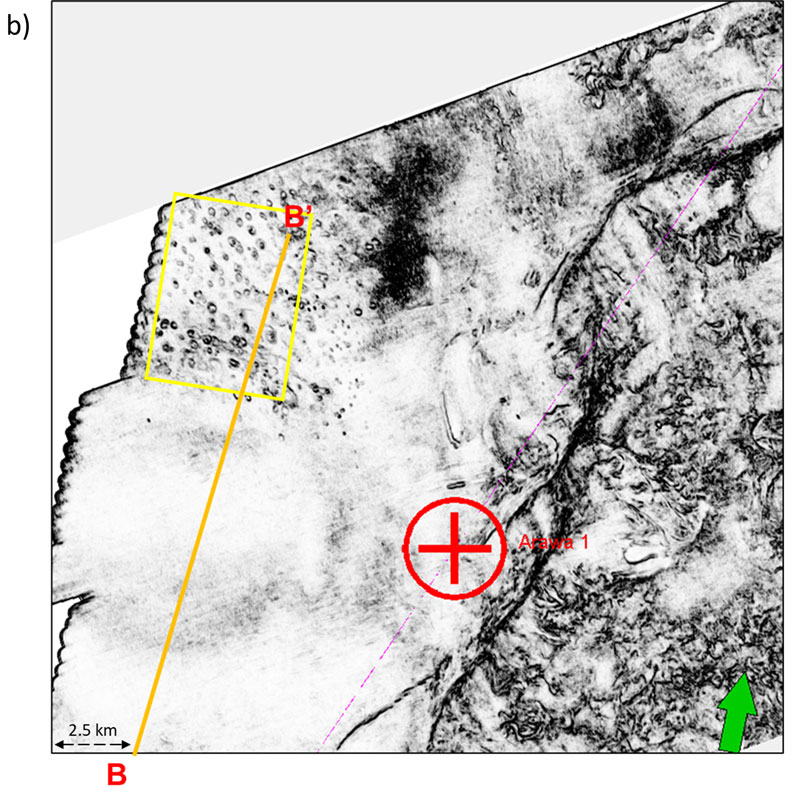
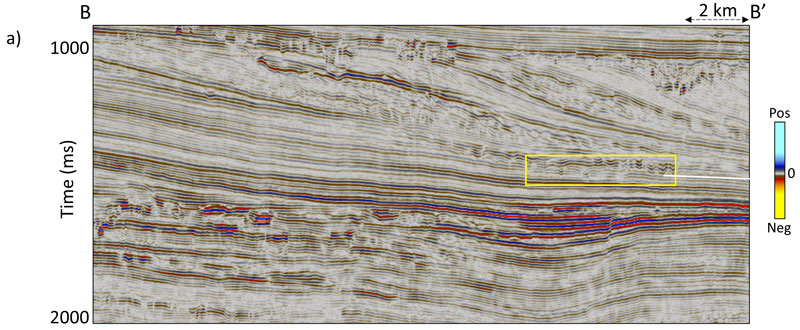
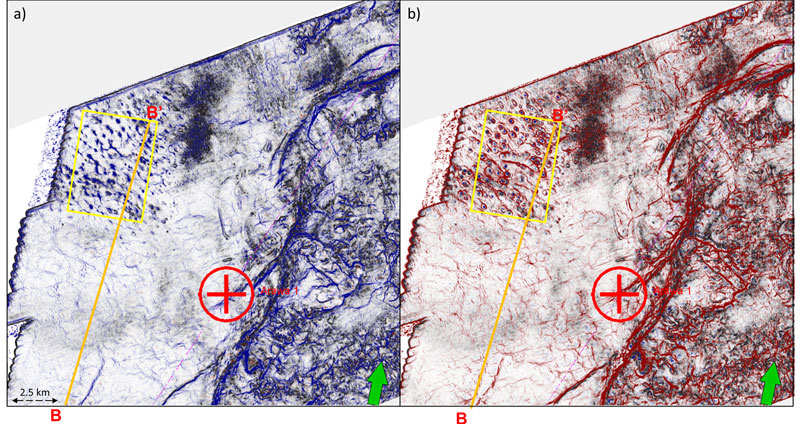
Although pockmarks usually occur at the seafloor, they can be buried and preserved deeper in the section also, as we see in the example from offshore New Zealand shown in figure 5a. The wavy ‘V’ shape moderate-amplitude seismic reflectors (seen in the yellow highlighted zone) represent pockmarks, and their attribute signatures can be seen on the coherence time slice shown in figure 5b. Figure 6 shows time slice (at 1.4 seconds) displays from the co-rendered energy ratio and curvature attribute volumes, which exhibit the composite pockmark signatures in the yellow rectangles, with the most-negative curvature in figure 6a and the most-positive curvature in figure 6b.
A recent study by the University of Washington and published in the Jan. 25 issue of Science Advances discusses the discovery of warm water, in addition to methane gas, spewing from the seafloor at a location 50 miles off Newport, Ore. The authors believe these fluids emanate directly from the Cascadia megathrust zone, or plate boundary, in the Pacific Northwest, where temperatures are estimated to be in the 150 to 250-degree Celsius range. This observation is believed to be the first of its kind, as usually the pockmarks are found to be associated with the leakage of oil and gas.
Conclusions
Seismic attributes allow a convenient interpretation for pockmarks appearing on seafloors in many of the ocean basins. Usually, because the pockmarks are associated with seepage of gas, the source for the migration of gas through the subsurface formations can also be understood by close examinations of the cut-away sections of coherence attribute as demonstrated above. Such interpretations could also be complemented with information about the source being biogenic or thermogenic by way of geochemical analysis.
Acknowledgements
The authors gratefully acknowledge access to the Smeaheia Dataset, published via the CO2 DataShare online portal administrated by SINTEF AS (CO2datashare.org).
(Editors Note: The Geophysical Corner is a regular column in the EXPLORER, edited by Satinder Chopra, founder and president of SamiGeo, Calgary, Canada, and a past AAPG-SEG Joint Distinguished Lecturer.)