

Seismic interpretation is fundamentally based on interpreting changes in amplitude.
Factors affecting amplitudes are shown in red for the sources, and cyan for those in the earth. Numbers refer to Table 1, where black lettering (F5-F8) indicates increased importance.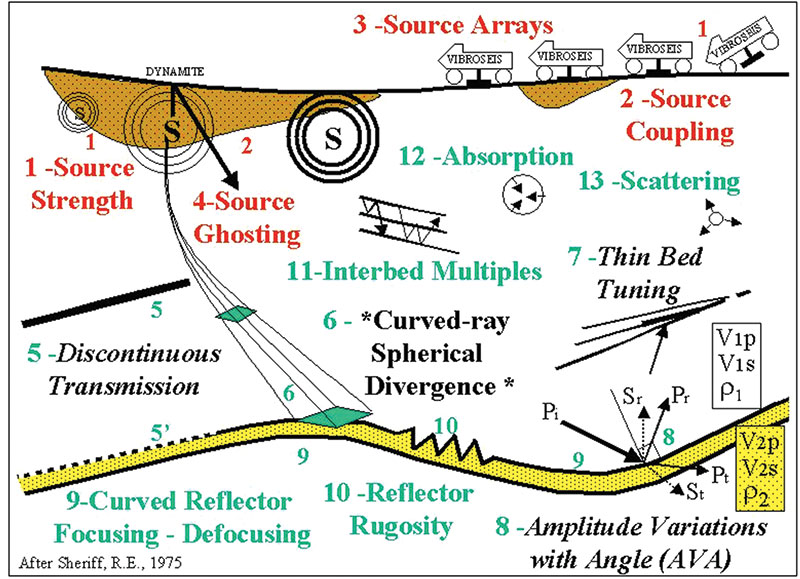
Figure 1
The changing amplitude values that define the seismic trace are typically explained using the convolutional model. This model states that trace amplitudes have three controlling factors:
- The reflection coefficient (RC) series (geology).
- The seismic wavelet.
- The wavelet’s interactions through convolution.
Factors effecting amplitudes are shown in blue for the receivers, and violet for the recording systems. Numbers refer to Table 1, where black lettering (F21) indicates increased importance.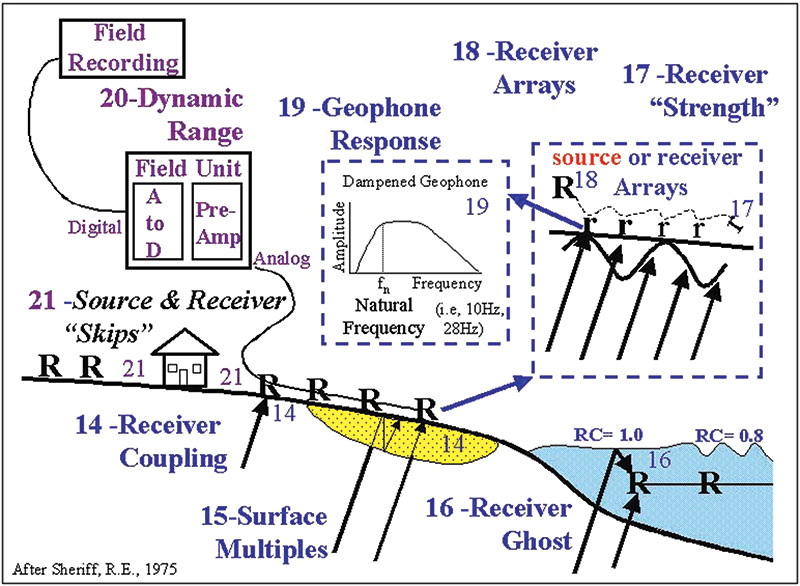
Figure 2
Large impedance (velocity x density) contrasts at geologic boundaries will generally have higher amplitudes on the seismic trace.
Interpreters associate changes in seismic amplitudes with changes in the geology; this is a good assumption only if all of the factors that affect trace amplitudes have been considered.
Part 1 of this paper presents the major effects that interpreters need to understand about seismic acquisition, where the wavelet is generated and the field trace recorded, and the interaction of the wavelet with the geology. Part 2 will discuss the factors effecting amplitudes in seismic processing and interpreter controls on the workstation (loading, processing and display).
When all these factors have been considered, then the changes in amplitudes can be more reliably related to changes in geology.
Over 20 factors that affect amplitudes, before seismic processing, will be presented. The magnitude of most of these can only be estimated, and removing their effects to obtain absolutely true amplitudes is impossible. Fortunately, relative changes in amplitude have been shown to be adequate, and have been successfully applied for reducing risk, such as direct hydrocarbon indicators, estimating lithofacies, etc.
The factors affecting amplitudes are illustrated in Figures 1 and 2. A checklist with brief comments describing the factors, along with an estimated magnitude of the effect is provided in Table 1.
Although only the moderate and major effects are discussed below, it is important to keep in mind how the amplitudes are being used in the interpretation. If a well is being proposed based solely on an amplitude anomaly, even a minor to moderate effect would need to be examined, as it could have a significant impact.
The five factors that have a big effect on amplitudes during the acquisition of field data are shown in black lettering on Figures 1 and 2.
The most important of these factors is the loss of energy due to curved-ray spherical divergence (F6). This effect on amplitudes is often approximated by the inverse square of distance, which for constant velocity is the inverse square of time. This factor is smaller for reflectors that are separated by less time, and minor for most lateral changes. For the real, non-constant velocity earth this effect is greater (1/v2t), but still inadequate for recovering true amplitudes of deep reflectors.
Laterally discontinuous (F5) high impedance geologic features can greatly reduce the amount of energy transmitted to the underlying geology. This reduces the amplitude of otherwise high amplitude reflectors beneath and over a lateral distance of half a spread length off the sides of the anomaly.
In extreme cases (e.g. salt, volcanics) the amplitudes of underlying reflectors can be reduced to below the noise level and disappear from the data.
Tuning (F7) occurs when the separation between RC creates constructive or destructive interference of the wavelet’s center and side lobes. This interference can increase or decrease amplitudes, and is most evident in areas of geologic thinning such as angular unconformities or stratigraphic pinch-outs. The magnitude of this effect can be major, but normally does not exceed a factor of 1.5 as determined by the size of the side lobes.
Amplitude variations with angle (AVA or AVO) relate relative amplitude changes (F8) in pre-stacked data to combined rock and pore-space fluid properties. This effect can be large for some gas effects. The appearance of this offset-dependent variation will be much less apparent on the stacked trace that contains the summation of all offsets.
Overall on the final stack, AVA effects are in the range of a factor of 2-5 compared to no AVA.
The placement of sources and receivers on the surface of the earth is not always uniform, resulting in missing ground positions (F21) that can have a moderate to major effect on amplitudes. Often, buildings, platforms, lakes, rivers, etc., must be avoided, stations are skipped and traces will be missing from the stacking bin. This reduces the ability of stack to reduce random noise — but the greater effect is a frequency unbalancing.
This paper is intended to provide the interpreter with a checklist of the factors that should be considered when associating amplitude changes on the seismic trace with changes in geology. Of these 21 factors, five are more important.
Compensation for curved ray spherical divergence is one of the primary goals of seismic processing. The other four factors mentioned above remain in the seismic data, as they are not normally corrected in seismic processing — which will be discussed next month.
Table 1.
This table provides a checklist of factors that affect amplitudes. Factors in bold are more important.
Seismic Acquisition (Source)
| Factors | Comments | Magnitude |
|---|---|---|
| F1) Source Strength | Size of dynamite, number of working vibrators, number of sweeps, etc. | Moderate |
| F2) Source Coupling | Source in dry sand, weathering (poor coupling), bedrock, wet soil (good) | Moderate |
| F3) Source Arrays | Designed to attenuate noise but also attenuates dipping primaries | Minor |
| F4) Source Ghost | Reflected signature with opposite sign at free surface | Minor |
The Earth
| Factors | Comments | Magnitude |
|---|---|---|
| F5) Discontinuous Trans | When RC large enough (Volcanics, Salt) underlying events not visible | Mod-Major |
| F6) Curved Ray | Spherical spreading of energy is the MAJOR effect, factor of 10 or more | MAJOR |
| F7) Tuning | Tuning can be major, up to factor of 2, at pinchouts can be down to zero | Mod-Major |
| F8) AVA | AVA gas effects can be up to a factor of 5 | Mod-Major |
| F9) Curved Reflectors | Focusing and defocused – minor, exceptions include salt lens – mod-major | Minor |
| F10) Rugosity | At seismic wavelengths most geologic surfaces are “mirror” smooth | Minor |
| F11) Interbed Multiples | If RC contrasts are high then can be moderate problem, generally minor | Minor |
| F12) Absorption | Loss of energy to heat, weighted towards high frequencies | Minor |
| F13) Scattering | Loss of energy due to specular reflections, weighted towards high frequency | Minor |
Seismic Acquisition (Receiver)
| Factors | Comments | Magnitude |
|---|---|---|
| F14) Receiver Coupling | Geophones dampened on dry soil, buried or wet soil couples well | Moderate |
| F15) Surface Multiples | Negative RC at surface, then positive at base weathering | Minor |
| F16) Receiver Ghost | Reflected RC with opposite sign at free surface, changing surface RC | Minor |
| F17) Receiver Strength | Poorly placed geophones, partial loss of array | Minor |
| F18) Receiver Arrays | Designed to attenuate noise but will also attenuate dipping primaries | Minor |
| F19) Geophone | Response is a filter that reduces amplitudes | Minor |
| F20) Dynamic Range | Pre-1990 with limited 12-15 bit recorders / filters Moderate, now Minor | Minor |
| F21) S&R “Skips” | Missing ground positions / offsets, effects # traces and frequency content | Mod-Major |