

Seismic data do not image geological layers directly. They record reflections generated by contrasts in acoustic impedance, where acoustic impedance is controlled by P-wave velocity and density. At the boundary between shale and sand, a change in these elastic properties produces a seismic reflection. A second reflection is generated at the base of the sand where the properties change back to shale.
When the sand interval is sufficiently thick, the reflections from its top and base are separated in time and can be identified as two distinct seismic events. However, as the sand becomes thinner, the wavelets associated with these two interfaces begin to overlap. Their interaction changes the amplitude and shape of the recorded seismic response. This phenomenon is known as “seismic tuning.”
A wedge model provides a simple way to demonstrate this behavior. In a conventional wedge model, the elastic properties of shale and sand are kept constant while the thickness of the sand gradually increases from zero to a value at which the top and base reflections are fully separated. A reflection-coefficient series is calculated from the resulting acoustic-impedance model and convolved with a seismic wavelet to generate a synthetic seismic section (figure 1).
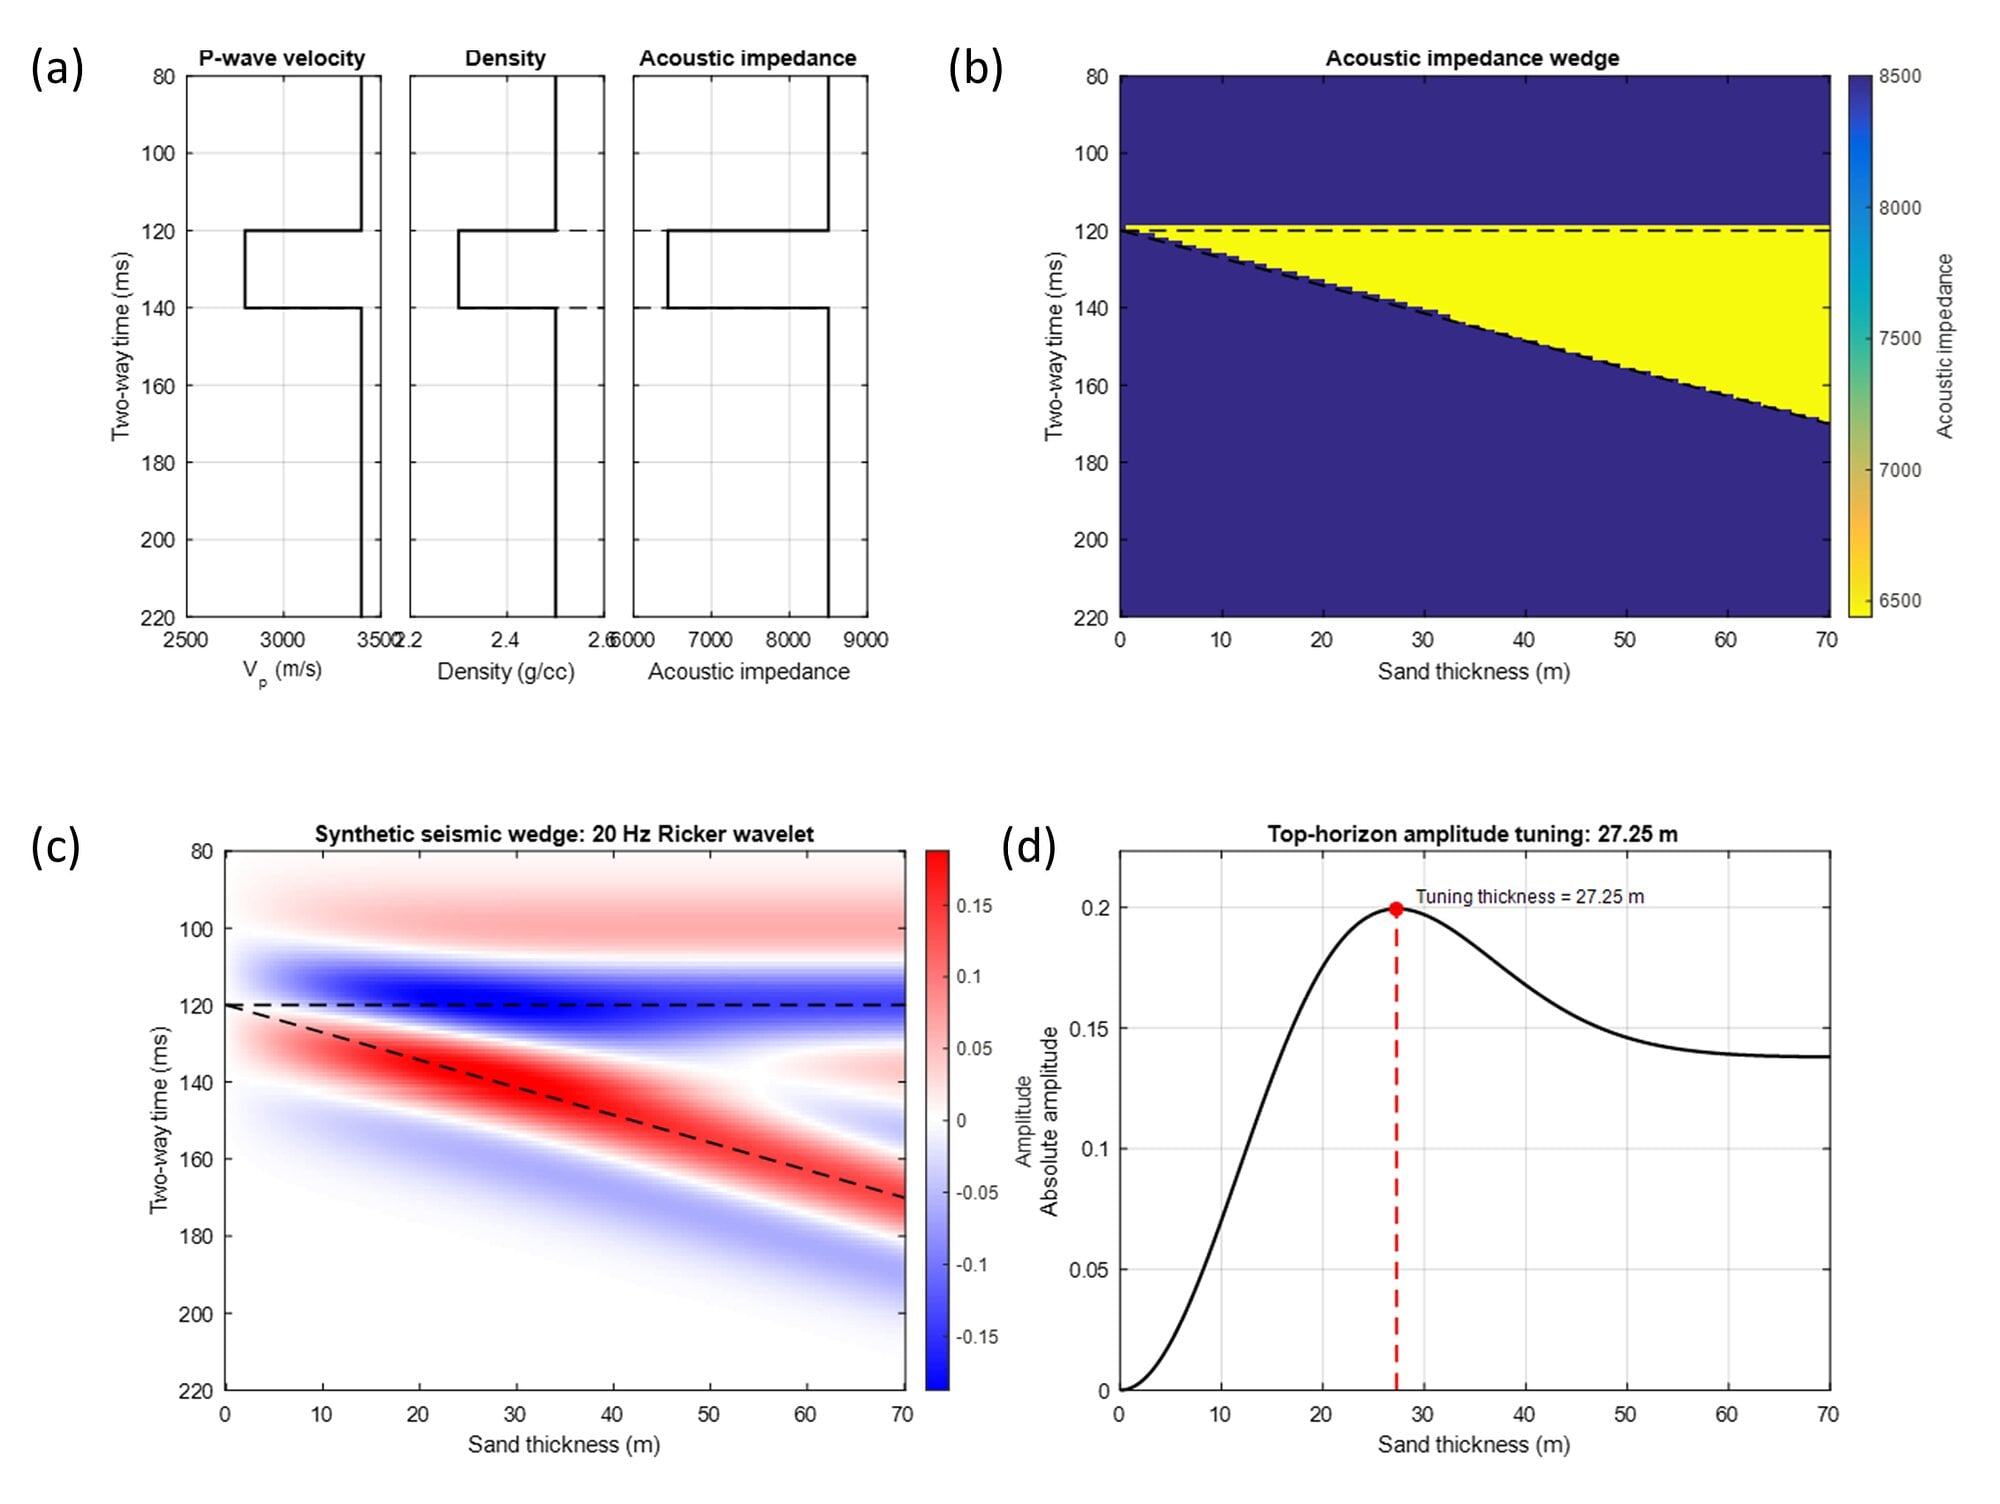
The wedge model therefore shows three important thickness regimes.
For relatively thick sand intervals, the top and base reflections are separated, and the bed is seismically resolved. As the thickness decreases, the reflections begin to interfere. At a particular thickness, constructive interference commonly produces the strongest composite amplitude. This is generally referred to as the “tuning thickness.” Below this thickness, the top and base can no longer be resolved independently, and the seismic response represents the combined effect of both interfaces rather than the true thickness of the sand body.
Understanding tuning thickness is important because seismic amplitude is often used as an indicator of reservoir presence, quality or thickness. Near and below tuning, however, amplitude does not depend only on the acoustic properties of the reservoir. It is also strongly influenced by interference between the top and base reflections. This can have several implications for exploration and development.
A thin reservoir might produce a strong amplitude because of constructive interference and may appear more significant than its true thickness would suggest.
Conversely, destructive interference may weaken the response of a potentially important reservoir. Apparent seismic thickness may differ from geological thickness, and the lateral limits of a reservoir may be difficult to define where the interval becomes thinner than seismic resolution. Thickness estimates derived directly from seismic amplitude can therefore become unreliable without understanding the tuning behavior.
Tuning analysis is also important during development because it affects reservoir mapping, volumetric estimation, well placement and the interpretation of lateral amplitude changes. An amplitude decrease across a field may indicate thinning, but it may also result from changes in acoustic impedance, wavelet interference or both. Separating these effects is essential before amplitude is interpreted in geological terms.
The conventional wedge model is valuable for explaining the physics, but it usually represents only one selected combination of shale impedance, sand impedance and seismic wavelet.
In a real area of study, these properties are not constant.
Shale and sand acoustic impedances vary between wells and also vary vertically and laterally because of changes in lithology, porosity, compaction, fluid content, and burial history.
As a result, there is not a single unique wedge model for the study area. Many different shale–sand impedance combinations are geologically possible. Each combination can produce a different reflection strength, a different interference pattern and potentially a different tuning thickness.
It would be possible to construct wedge models for every combination of shale and sand properties, but the number of possible cases quickly becomes very large. More importantly, selecting only a few representative combinations might not adequately capture the range of responses expected from the observed geological variability. To address this challenge, a Monte Carlo wedge-modeling workflow was developed to quantify the uncertainty associated with seismic tuning thickness as discussed next.
Methodology
The statistical workflow considers a shale-sand-shale sequence in which the elastic properties of the three layers are represented by probability distributions rather than fixed values. P-wave velocity and density are repeatedly sampled to generate plausible geological realizations.
For each realization, elastic properties are assigned independently to the shale above the reservoir, the reservoir sand, and the shale below. Reflection coefficients are calculated at the top and base of the reservoir, after which a wedge model is constructed by systematically increasing the reservoir thickness. The resulting reflectivity series is convolved with a Ricker wavelet to generate synthetic seismic traces. Amplitude is then extracted along the known top-reservoir horizon as a function of thickness, and the thickness associated with a distinct local amplitude maximum is identified as the tuning thickness for that realization. Figure 1 illustrates this procedure for a representative case.
Repeating the workflow over many realizations produces a distribution of tuning-thickness estimates rather than a single deterministic value. This distribution can be summarized using percentile measures such as P10, P50, and P90, thereby describing both the expected tuning thickness and the uncertainty introduced by elastic-property variability.
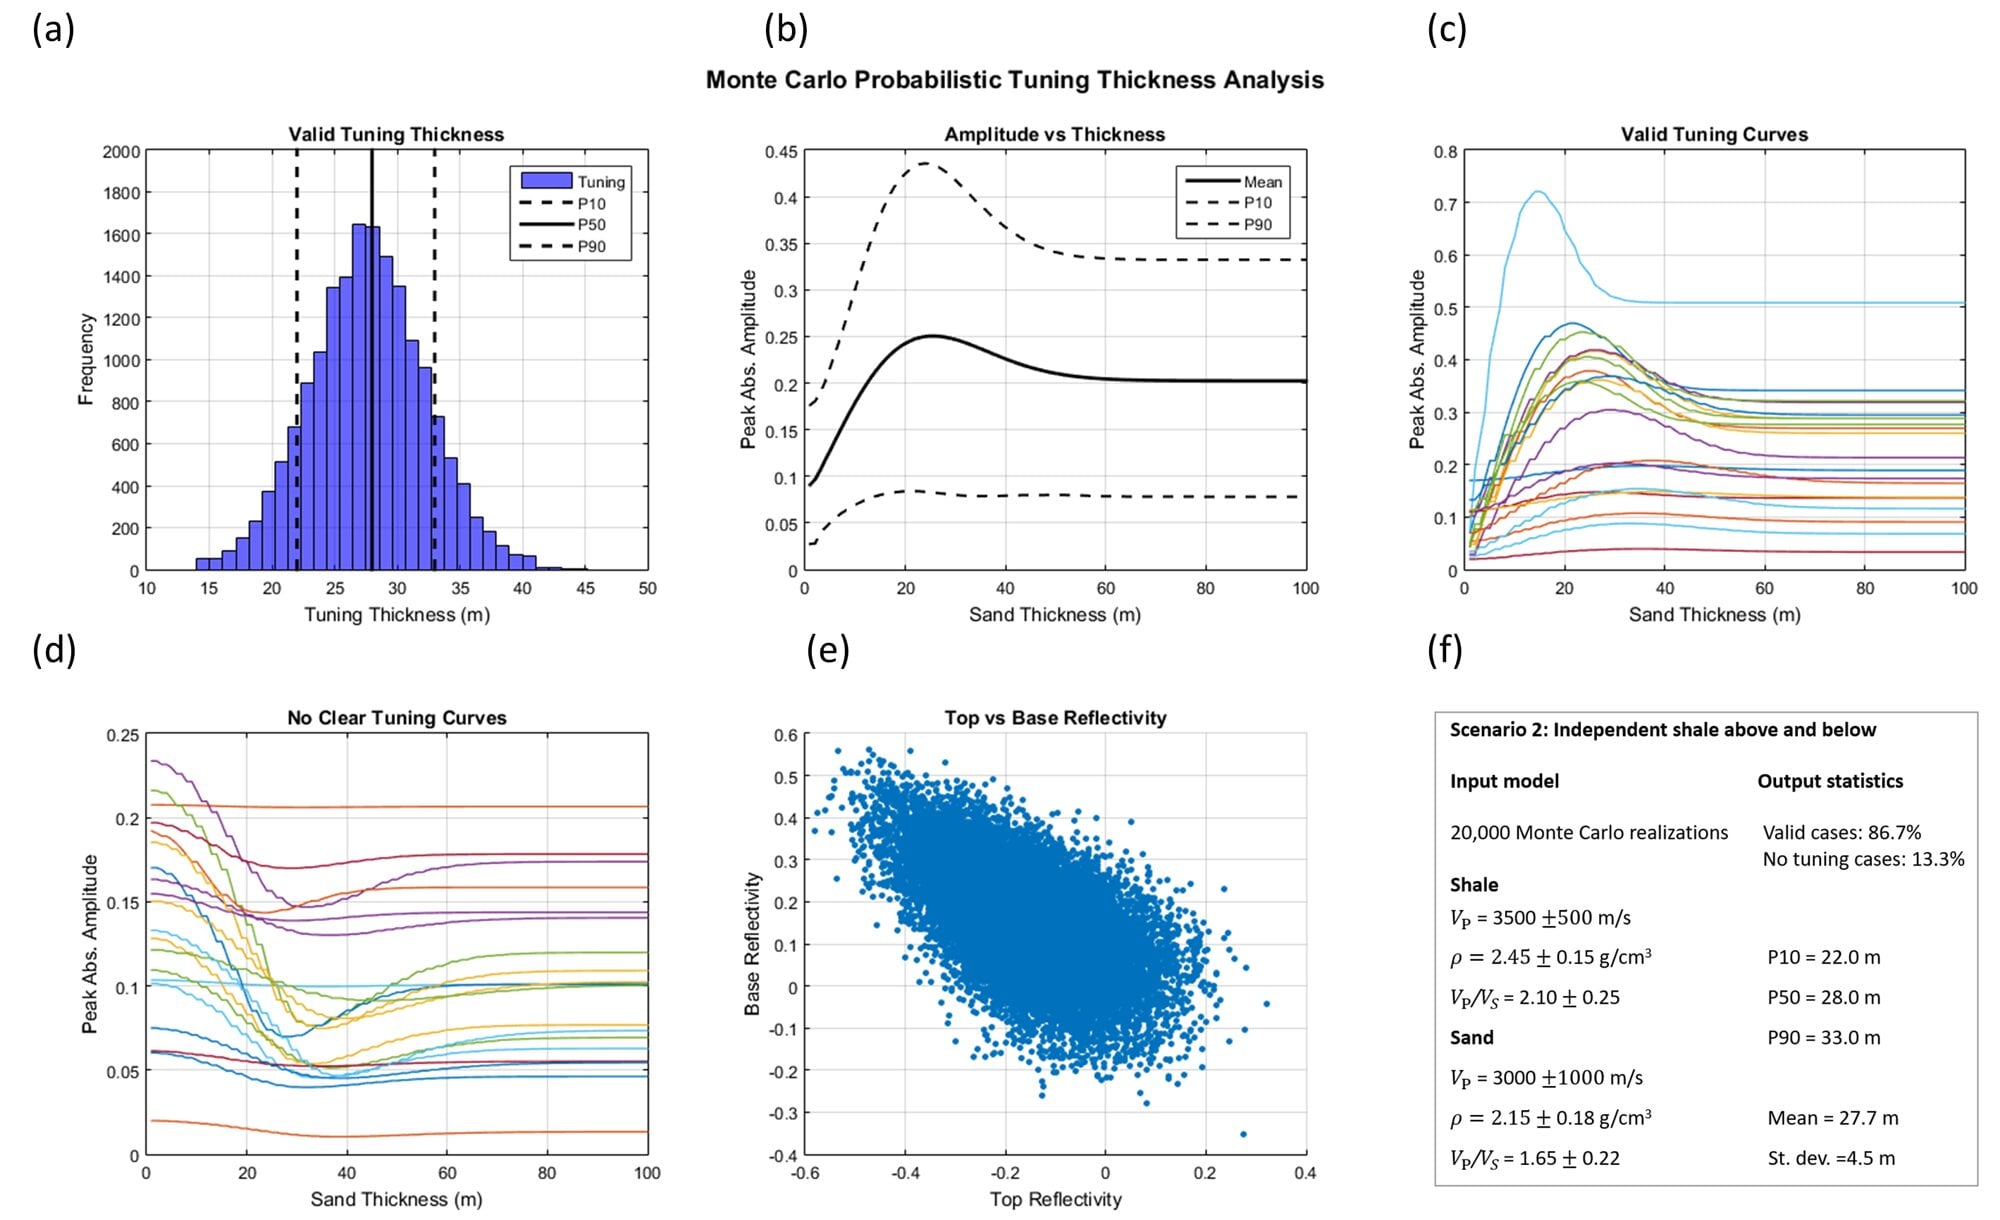
Figure 2 summarizes the results of 20,000 Monte Carlo realizations. The simulations generated a broad family of amplitude-versus-thickness curves representing different combinations of overlying shale, reservoir sand, and underlying shale properties.
Approximately 86.8 percent of the realizations produced a distinct amplitude maximum and were classified as valid tuning cases. The remaining 13.2 percent did not exhibit a clear tuning peak within the modeled thickness range. These non-classical responses arose from variations in the relative magnitude and polarity of the top- and base-reservoir reflection coefficients. Depending on these interface relationships, interference may enhance, suppress, or gradually modify the extracted amplitude without producing a readily identifiable maximum.
Among the valid cases, the tuning-thickness distribution yielded approximately:
- P10: 22 meters
- P50: 28 meters
- P90: 33 meters
The P50 value indicates that the most likely tuning thickness for the modeled shale–sand–shale system is approximately 28 meters, while the P10–P90 interval describes the range supported by most of the valid realizations.
The result is notably lower than the conventional quarter-wavelength estimate. For a sand velocity of 3,000 meters per second and a 20-hertz wavelet, the quarter-wavelength criterion gives 37.5 meters. This difference illustrates that it should be treated as a general resolution guideline rather than an exact tuning-thickness estimate. The Monte Carlo workflow determines tuning directly from the synthetic amplitude response of the wedge, following the same basic principle used when tuning is interpreted manually from wedge models in commercial seismic applications.
The value of the probabilistic approach therefore lies in two outcomes: it provides a data-driven range of plausible tuning thicknesses, and it quantifies how often a clear tuning signature can be expected under realistic rock-property variability.
Limitations and Future Work
The present analysis uses a one-dimensional shale-sand-shale wedge, normal-incidence reflectivity, and a fixed Ricker wavelet. Real seismic data may contain spatially varying bandwidth, noise, phase changes, lateral heterogeneity, anisotropy, and more complex stratigraphy.
The elastic-property distributions in this demonstration were prescribed statistically. In field applications, they should be derived from conditioned well logs, facies-dependent rock-physics models, or other locally calibrated information.
Future development should include uncertainty in wavelet frequency and phase, prestack angle-dependent reflectivity, and the influence of thin-bed interference on amplitude-versus-offset behavior. This would allow the workflow to evaluate whether tuning enhances, suppresses, or distorts apparent AVO signatures and to propagate vertical-resolution uncertainty into reservoir-characterization workflows.
Conclusions
A Monte Carlo wedge-modelling workflow was developed to estimate seismic tuning thickness while accounting for variability in reservoir and bounding-layer elastic properties.
For the modeled example, approximately 86.8 percent of realizations produced a clear tuning maximum. The resulting P10, P50, and P90 tuning thicknesses were approximately 22, 28, and 33 meters, respectively. The remaining realizations did not exhibit a distinct tuning peak within the investigated range, demonstrating that classical tuning behavior cannot be assumed for every plausible geological configuration.
The probabilistic estimate was lower than the 37.5-meter quarter-wavelength value calculated from a sand velocity of 3,000 meters per second and a dominant frequency of 20 hertz. This highlights the difference between a theoretical resolution guideline and tuning estimated directly from modeled seismic amplitudes.
The main contribution of the workflow is therefore not simply the calculation of a tuning thickness, but the estimation of its uncertainty and the probability that a recognizable tuning response will occur.