
Over the past two decades, unconventional oil and gas developments such as shale plays and tight gas formations have transformed global energy. Projects often involve well inventory with many horizontal wellbores producing complex spacing patterns.
Acquisition and divestiture directors to whom I speak often mention that, in any deal, the future “well inventory” (that is, permitted locations and potential future drilling opportunities) represents most of the value. Thus, a detailed understanding of the well inventory is no longer confined to the drilling department – it feeds into everything from technical planning to capital allocation and regulatory compliance.
Even now, well-inventory mapping is sometimes done using manual drawing of well sticks or spreadsheet-based mathematical calculations. While these methods were once practical, they are obsolete in modern unconventional development or deal analysis, where speed, accuracy and analytical integration are required. Instead, geographic information system technology provides the accuracy, analytical power and scalability needed for modern unconventional well-inventory mapping.
GIS technology has become a crucial tool in unconventional well-inventory mapping, offering capabilities that surpass the limitations of manual or non-spatial mathematical mapping methods. It’s no coincidence that leading unconventional companies have embraced GIS technology.
What is Unconventional Well-Inventory Mapping?
Well-inventory mapping involves the identification and spatial plotting of potential future drilling (and therefore production) locations. In unconventional plays, this is more than just drawing lines on a map, it requires integrating multiple datasets, including:
- Existing subsurface well locations of varying azimuths and target formations
- Multi-well pads surface locations
- Lease or unit boundaries for spacing and setbacks
- Infrastructure (roads, pipelines, pads)
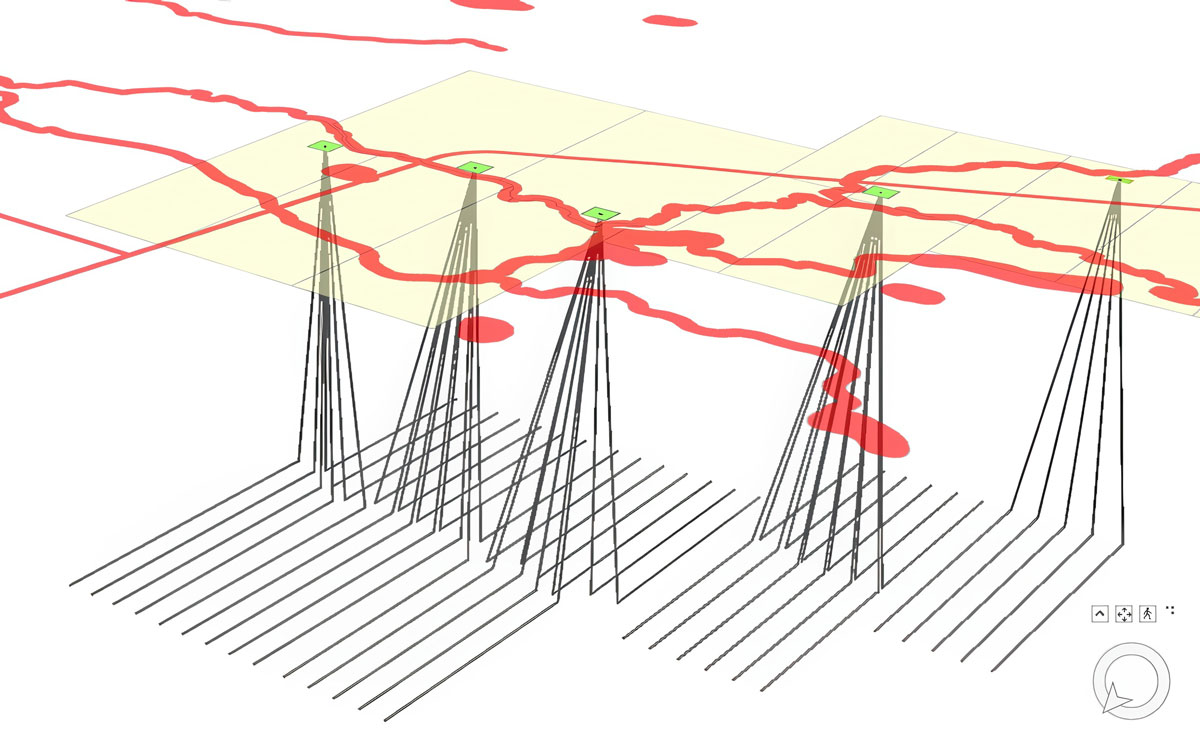
For example, in a shale gas play, tens of horizontal wells may be drilled from a single pad, each with a unique trajectory and landing zone. These wells interact with one another in terms of drainage, spacing, and production interference, so mapping must capture not only where a well is spudded but also where its lateral section extends and terminates in 3-D.
Why GIS Is Leading Well–Inventory Mapping?
- Spatial accuracy and location: In unconventional plays, even small errors in location data can be costly as they lead to lease-line violations, production interference and other issues. GIS ensures geospatial accuracy by anchoring data to standardized coordinate systems. When wellbores, property boundaries and setback buffers are all drawn from the same georeferenced framework, compliance checks become instant and defendable.
By contrast, manual plotting or spreadsheet-based coordinate calculations offer fewer opportunities to visualize and catch location errors before they can cause planning or permitting problems.
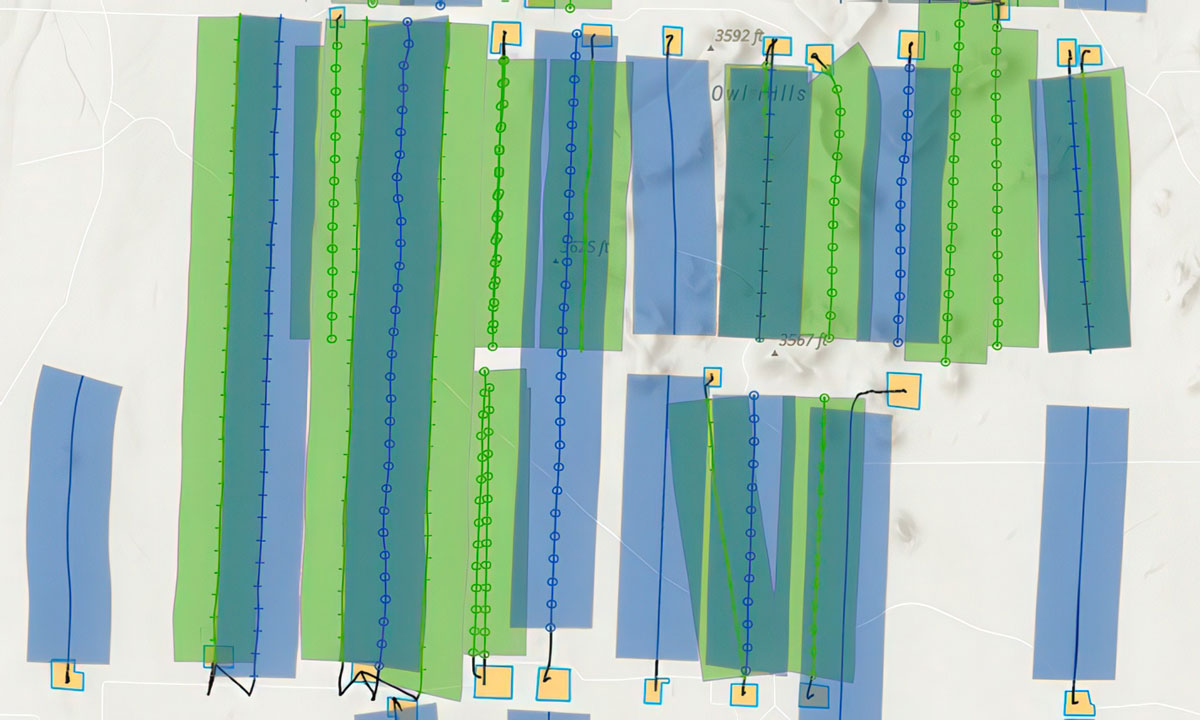
- Integration of multiple data layers and formats: GIS allows easy integration of multiple datasets such as well surveys, lease polygons, infrastructure footprints and environmental constraints into a single map. Users can apply filters or combine data in new ways to reveal relationships not seen in purely tabular workflows.
For example, an operator can identify permitted wells that intersect zones with geological complexities or overlay planned locations with infrastructure to optimize pad placement. Meanwhile, integration and analysis between spatial (the map), tabular and graphical displays further expands a user’s ability to see previously unforeseen patterns in business data and enhances decision making.
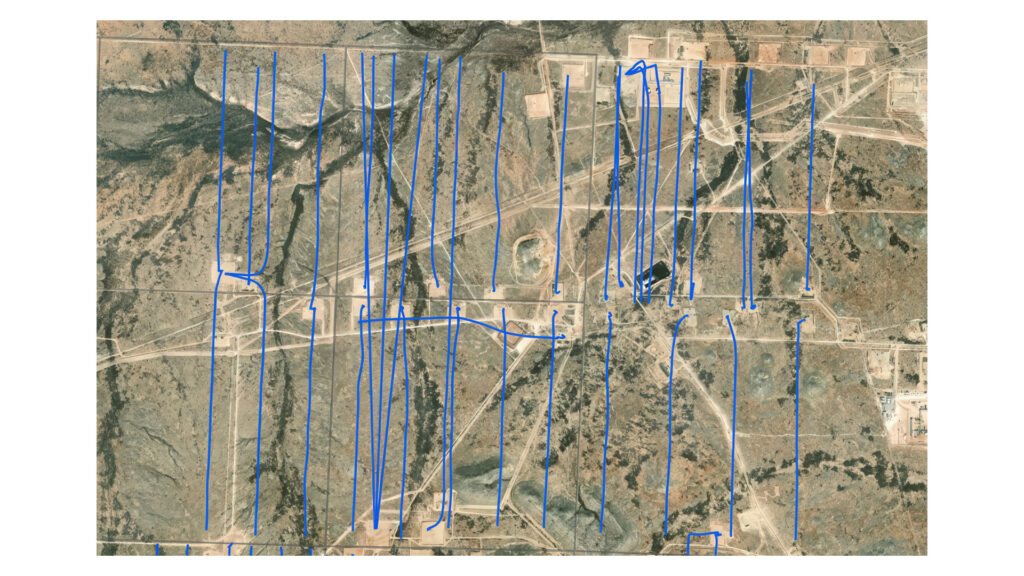
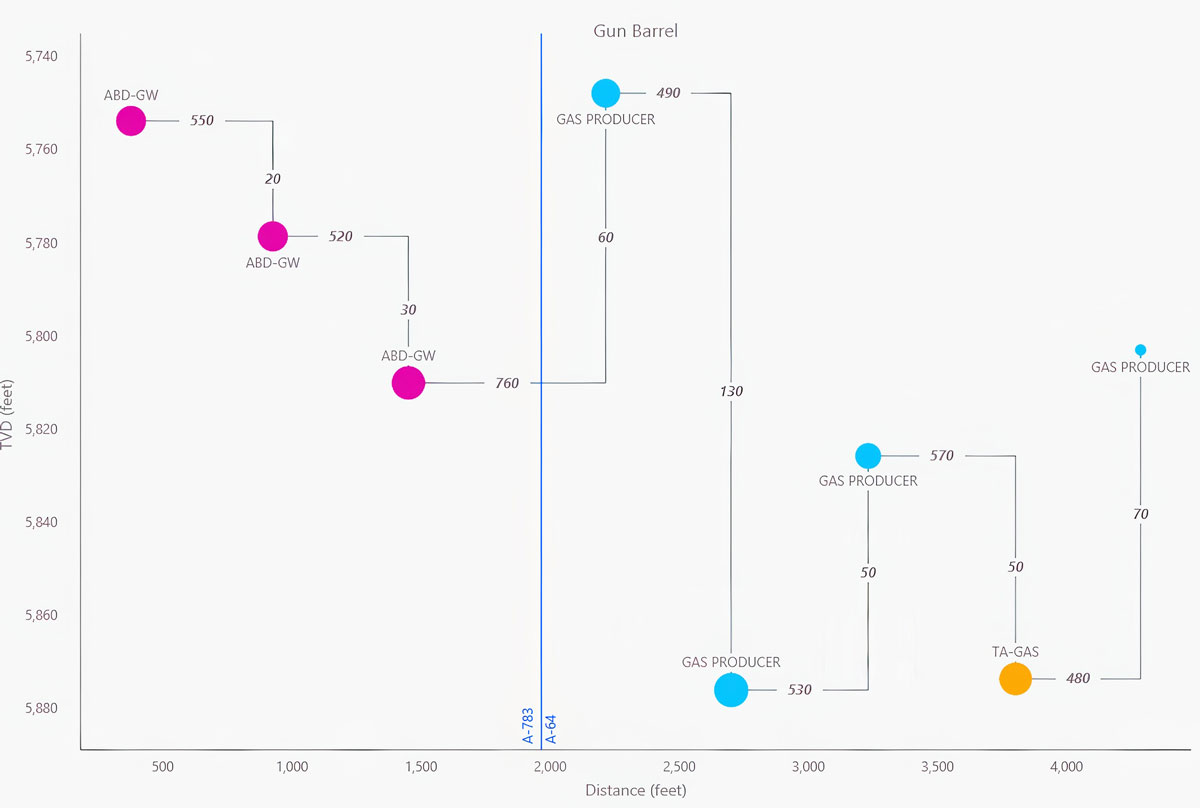
One graphical or charting product common in unconventionals developments is the Gun Barrel plot, which shows the relationship between wells in cross-section view. In a GIS environment, these can be produced on the fly by simply drawing a line across a set of horizontal well bores.
In manual or mathematical workflows, this would require multiple disconnected analyses and take significantly more time to create.
- Dynamic updates and real-time visualization: Unconventional well inventory changes constantly. New leases are issued, wells are drilled and inventory spacing changed. Automated or programmatic GIS tools enable live updates, especially when leveraging custom developed tools or connected to cloud-based enterprise databases.
With manual mapping, updating means redrawing or editing files – a time-consuming process that delays decision making. With spreadsheets or mathematical methods, updating requires recalculations and re-checking of coordinates without immediate visual confirmation. GIS platforms update instantly and visually, giving industry professionals an up-to-date Common Operating Picture.
- Advanced spatial analysis tools: Mapping aside, GIS enables spatial analytics and geoprocessing that can reveal previously unseen scenarios and trends.
Examples include:
- Proximity analysis: to place pads within setback distances from structures or environmental constraints
- Density mapping: to identify over/under-drilled areas
- Calculating spacings between existing wells: to better understand production regimes and parent-child relationships
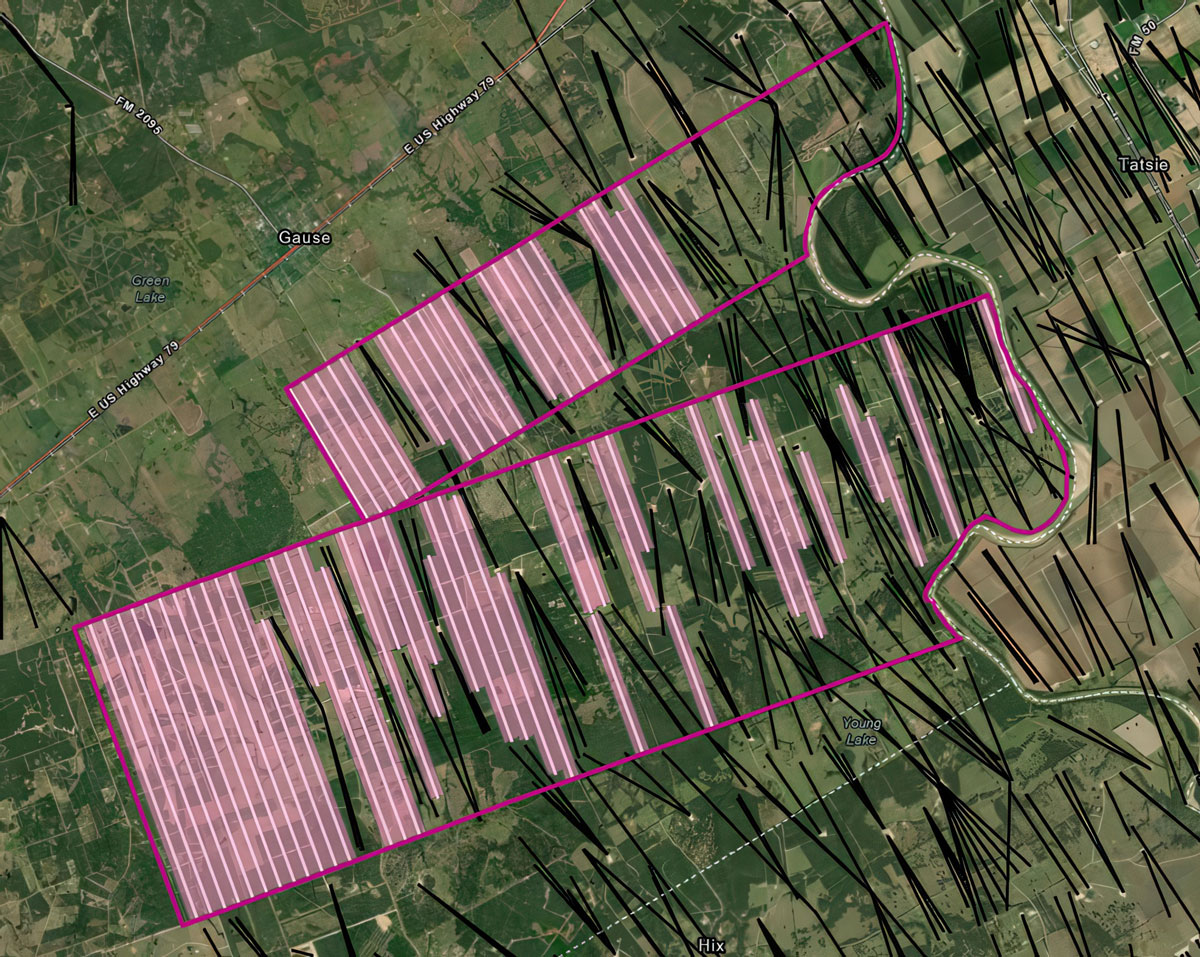
- Automated well stick placement: within arbitrary polygons at defined spacing, such as new lease acquisitions
These tools replace the need for ad hoc calculations and deliver accurate results in minutes rather than days.
- Regulatory compliance and audit trails: GIS can store regulatory buffers built around setbacks and lease boundaries, ensuring that planned wells comply with regulations before the permitting process begins. Audit trails can also be maintained, documenting when and how well locations were established, which are critical for disputes, compliance checks, or when industry professionals return to iterate development plans.
Manual mapping offers no systematic way to maintain audit trails, while spreadsheet records alone lack the spatial evidence required for legal or regulatory challenges.
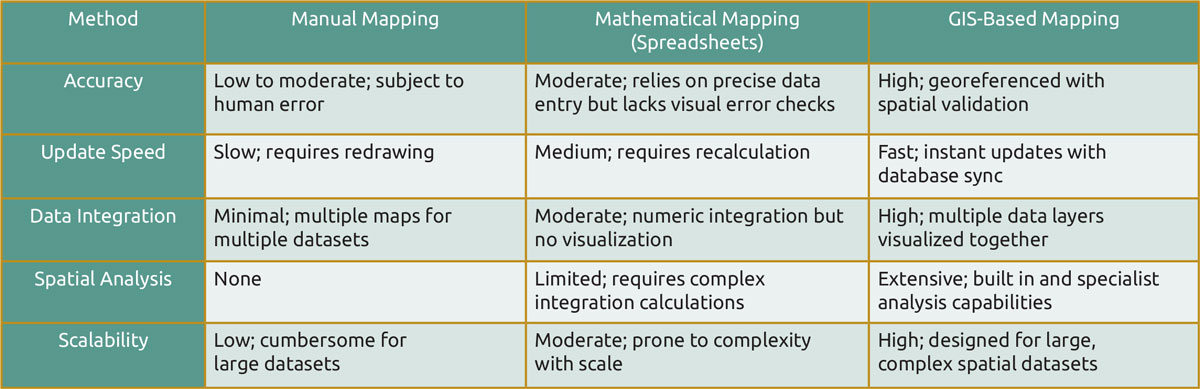
Comparing GIS to Other Methods
In short, manual and mathematical methods lack the dynamic and integrated upside of a GIS-centric method.
Let’s take an example where an operator in the Permian Basin is planning a 60-well development program. Using a GIS workflow, they could:
- Import all existing wells from state or third-party databases.
- Overlay lease boundaries and find unpermitted acreage availability.
- Apply setback buffers to ensure compliance with Texas Railroad Commission rules.
- Place inventory well sticks at defined spacing to maximise production efficiency
- Analyze pad placement against topography, road access and environmental constraints.
- Model potential parent-child well interference to refine lateral planning and assess relationships in gun barrel plots.
Within hours, the team produces a development plan that is spatially accurate, regulatory compliant, and optimized for efficiency around user selected value drivers (for example, lateral length and idealized spacing), something that would take days or weeks without GIS.
The Cost of Not Using GIS
The consequences of avoiding GIS in unconventional well-inventory mapping can be severe:
- Regulatory violations from incorrect placement or setbacks
- Lost acreage due to missed or incorrectly mapped drilling locations
- Higher operational costs from suboptimal pad and lateral planning
- Disparate solutions as different departments follow their own unique solutions, resulting in inconsistent practices and lost time.
In unconventional plays, where margins are often dictated by efficiency and accuracy, these risks directly translate to lost value.
Conclusion
As unconventional oil and gas regions grow in complexity, GIS is no longer a luxury, it is an operational necessity. GIS integrates multiple datasets and formats, delivers spatial accuracy, enables real-time updates and supports advanced analytics unavailable to manual and mathematical methods.
In the past, mapping operations was about getting a static view of the field. Today, it’s about maintaining an interactive spatial database or “digital twin” that guides multidisciplinary teams in their drilling, compliance, acquisition and asset-management decisions. For unconventional operators, mergers and acquisitions specialists, banks and investment companies the choice is clear: embrace GIS or risk falling behind in efficiency and losing a competitive edge.