


Analyzing the relatively uncommon Teager-Kaiser energy attribute and its application to a seismic dataset from the Lower Magdalena Valley in onshore northwest Colombia, the results show that TK energy effectively highlights gas-related anomalies, revealing them as localized and well-defined features. Additionally, incorporating TK energy into the attribute suite used for self-organizing mapping analysis in unsupervised seismic facies classification produced promising outcomes. The resulting facies display exhibited a much clearer delineation of gas-related anomalies compared to the more cluttered results obtained without TK energy. The TK energy attribute is a valuable addition to the seismic interpreter’s toolkit, with strong potential for identifying hydrocarbon reservoirs in this and similar geological settings.
Measuring Instantaneous Energy
The simplest method for computing the time-variant energy of a seismic trace involves calculating a running window sum of squared amplitude samples. In contrast, the TK energy attribute is derived from the physical principles of a simple harmonic oscillator, where energy is shown to be proportional to both the square of the amplitude and the square of the frequency of oscillation. Building on this insight, TK energy was introduced into signal analysis as a means of estimating a signal’s instantaneous energy by incorporating both its amplitude and frequency content. Due to its sensitivity to rapid signal variations, TK energy has found widespread use in speech processing and biomedical signal analysis.
One of our co-authors (Matos) previously demonstrated that the energy density of seismic data, defined as seismic energy per unit volume, is analogous to that of an oscillating mass-spring system. This observation led to the introduction of TK energy computation in the context of seismic traces. However, when applied to multifrequency signals such as seismic data, the discrete TK energy formulation can suffer from cross-term interference. To address this, the continuous wavelet transform was employed (for more information see the December 2013 and March 2014 installments of Geophysical Corner), allowing TK energy to be computed within individual frequency sub-bands, thereby mitigating cross-term effects. Subsequently, the same co-author refined the approach by applying first- and second-order smooth, noise-robust differential filters, further reducing cross-term artifacts and enhancing the quality of the attribute.
TK energy provides more localized and distinct estimates of instantaneous energy compared to simple running window computations. This is largely due to its sensitivity not only to amplitude variations but also to frequency changes, allowing it to more effectively detect subtle events within seismic data. The algorithm is computationally efficient, and the results are compelling, as demonstrated in the following example.
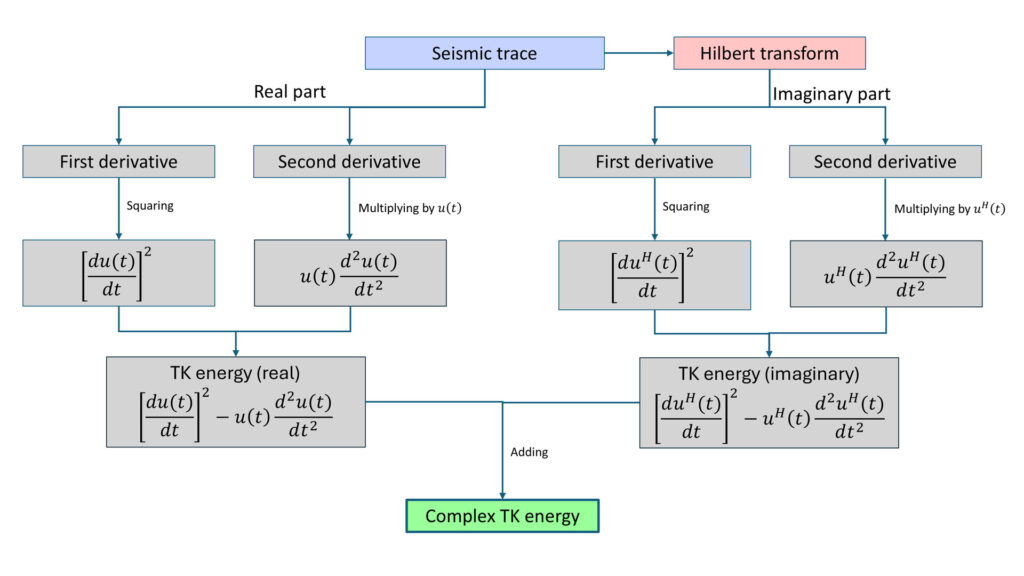
In the broader signal analysis literature, it has been shown that the TK energy of a complex signal is equivalent to the sum of the TK energies of its real and imaginary components. Based on this, we compute the TK energy of the complex (analytic) seismic trace, rather than limiting the analysis to the amplitude component alone.
Figure 1 presents the workflow used to compute TK energy from preconditioned seismic data.
Application
To demonstrate the value of the TK energy attribute, we analyze a 3-D seismic data volume acquired from the prolific Lower Magdalena Valley Basin, located onshore in northwest Colombia. The interval of interest spans from the Mid Miocene Unconformity down to the basement, encompassing the main reservoir sands of Late Miocene age.
Data conditioning: Seismic data often retain random noise, even after multiple noise attenuation steps and proper migration. Seismic attributes are most effective at highlighting subtle geological features when applied to relatively noise-free data. To reduce the impact of residual noise, interpreters commonly use structure-oriented filtering, which enhances signal quality while preserving the structural integrity of seismic events.
The multiwindow principal component (Kuwahara) filter, introduced by the second author in 2006, utilizes a vertical window of seismic samples to identify the waveform that best represents the signal within a specified spatial analysis window (for practical applications, see the October 2014 Geophysical Corner). In our study, we applied this filter using 99 analysis windows, each covering nine traces and 10 milliseconds on either side of the analysis point (11 samples), oriented parallel to the local dip and azimuth around each analysis point. The principal component filter was then applied using the window that exhibited the highest coherence.
Seismic data processed with the PC filter generally display a significantly improved signal-to-noise ratio, resulting in clearer imaging of faults, fractures and stratigraphic features such as channels. Autotrackers also perform notably better on PC-filtered data, producing continuous surfaces that terminate appropriately at geological discontinuities. Furthermore, attributes derived from PC-filtered volumes tend to be more interpretable and geologically meaningful than those extracted from unfiltered data.
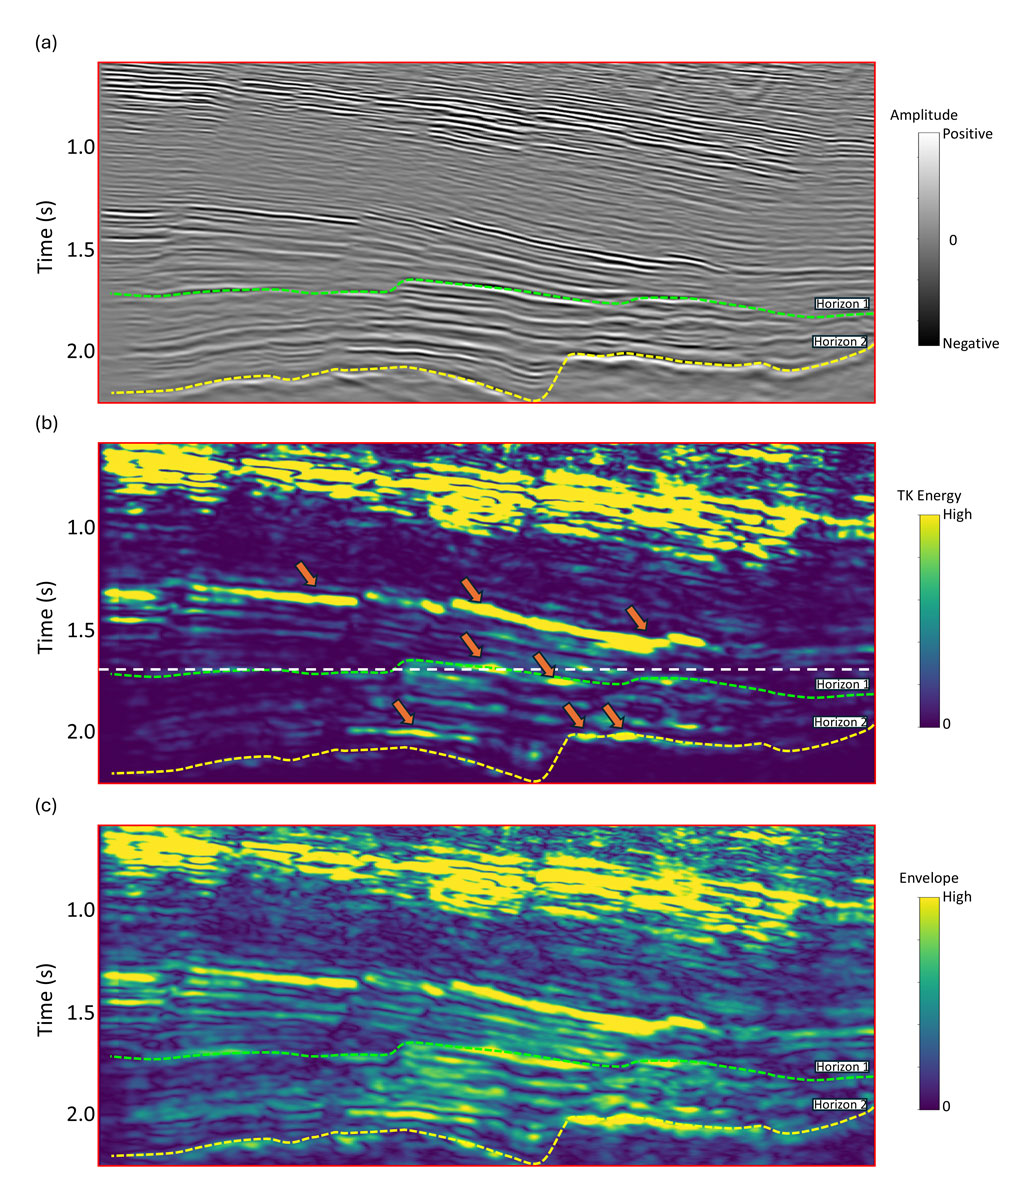
Analyzing the TK energy attribute: Figure 2a displays a segment of a seismic section with two interpreted horizons, labeled 1 and 2, where horizon 2 corresponds to the basement. The lower half of the section shows faulting, and several high-amplitude reflections, potentially related to gas anomalies, are present. However, these features might be difficult for interpreters to confidently identify in the seismic amplitude data alone. In contrast, the corresponding TK energy section shown in figure 2b reveals these anomalies more clearly, appearing as localized, distinct features highlighted with orange arrows, thereby aiding interpretation.
Given that the TK energy attribute yields only non-negative values, an inquisitive interpreter might wonder whether it behaves similarly to the amplitude envelope instantaneous energy attribute. To address this, figure 2c presents the equivalent envelope instantaneous energy section. While this attribute also produces a smoothed, non-negative output, the localized anomalies evident in the TK energy section are largely absent, resulting in a noticeably different visual character.
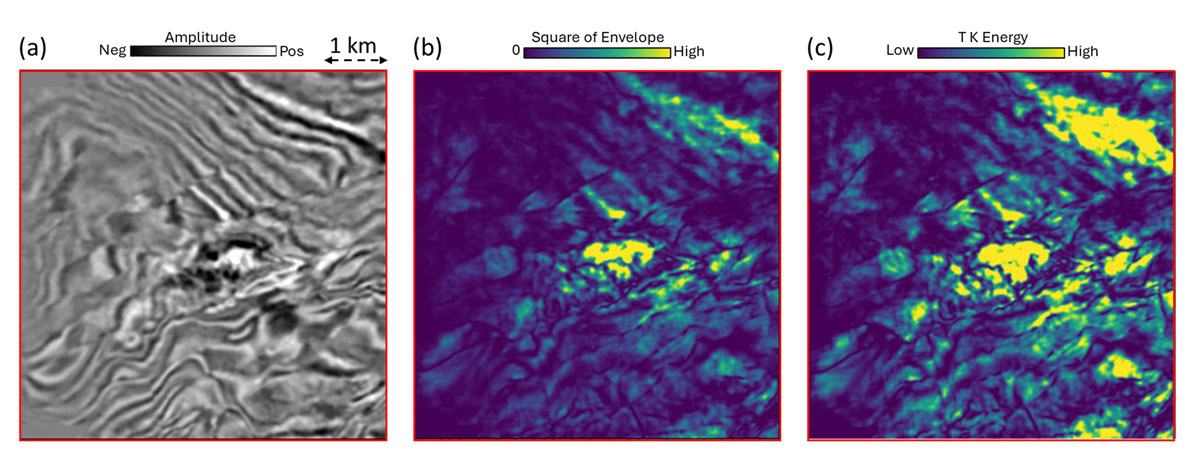
Further comparison is provided in figure 3, which shows time slices at t=1.714 seconds from the same three data volumes, namely, seismic amplitude, TK energy and envelope instantaneous energy. The time level is marked by a white dashed line in figure 2b for reference. This comparison underscores that TK energy and envelope instantaneous energy are not interchangeable and supports the distinct value of the TK attribute in highlighting subtle, localized features.
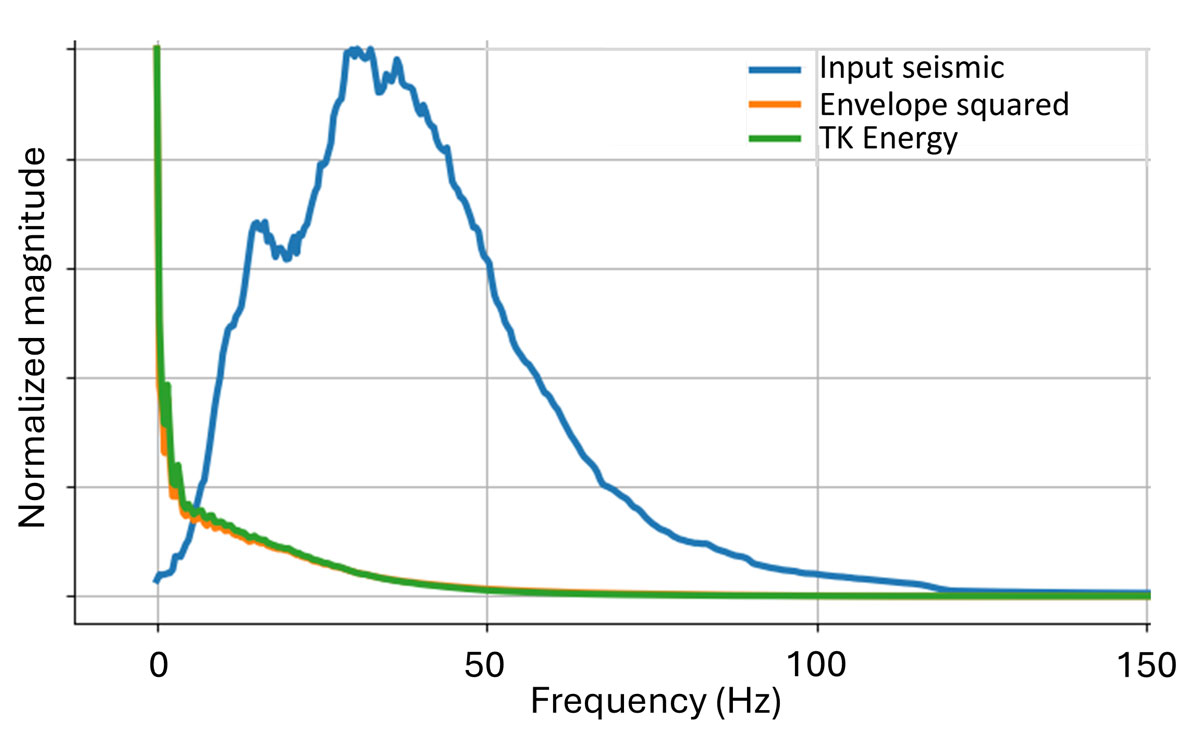
Additionally, a comparison of figures 1a and 1b shows that the frequency content of the TK energy is somewhat lower than that of the seismic amplitude data. Figure 4 provides further insight by showing the frequency spectra of the seismic amplitude, envelope instantaneous energy, and TK energy volumes. The dominant frequency range of the seismic amplitude data lies between 18 and 45 hertz. Notably, both envelope instantaneous energy and TK energy include a zero-hertz component, arising from their strictly positive or nonlinear nature, which contributes to their relatively lower-frequency appearance. These spectral characteristics further distinguish the TK energy attribute and highlight its unique contribution to seismic interpretation.
The Value of TK Energy in Unsupervised Seismic Facies Classification
To further explore the utility of the TK energy attribute, we incorporated it into the attribute mix used for unsupervised seismic facies classification. The method employed for this task is self-organizing mapping.
SOM is a powerful tool for clustering high-dimensional attribute data and projecting it onto a two-dimensional representation. In SOM, the process begins by defining the best-fitting plane through the N-dimensional attribute space, typically using the first two eigenvectors of the covariance matrix. This initial plane is iteratively deformed into a 2-D manifold that better conforms to the data distribution. Once convergence is achieved, the high-dimensional data are projected onto this manifold, which is subsequently mapped onto a 2-D latent (or hidden) space.
In our implementation, this latent space is represented by two axes: SOM1 and SOM2. This format allows interpreters to identify clusters either explicitly (for example, by drawing polygons around regions of interest) or implicitly using a 2-D color map to visualize facies distributions.
For the initial classification, we selected six seismic attributes: relative acoustic impedance, sweetness, gray-level co-occurrence matrix homogeneity and spectral magnitude components at 20, 30 and 40 hertz. These specific frequencies were chosen based on the spectral analysis presented in figure 4, which shows amplitude maxima at those frequencies.
Next, we repeated the SOM classification using the same set of attributes, but this time included TK energy in the attribute mix. The addition of TK energy was intended to evaluate its contribution to facies differentiation, particularly in highlighting localized anomalies potentially related to gas-bearing features.
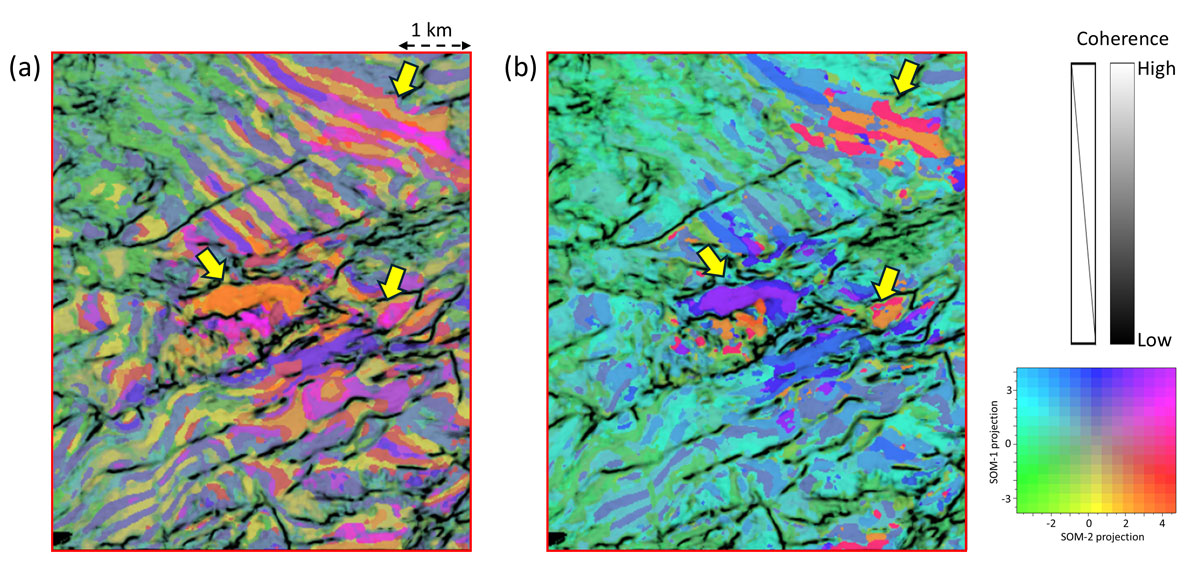
Figure 5 presents a comparison of time slices at 1.714 seconds from two SOM crossplot volumes, without TK energy (figure 5a) and with TK energy included (figure 5b). Both displays are co-rendered with multispectral coherence (see the July 2018 Geophysical Corner for definition and applications), which highlights fault lineaments in black. In figure 5a, the display appears cluttered, and the high-amplitude anomalies (indicated by yellow block arrows) are not easily distinguishable. In contrast, these same anomalies are more clearly delineated in figure 5b, demonstrating how the inclusion of TK energy enhances interpretability and provides a more focused visualization of potential gas-related features.
Conclusions
In this study, we introduced the relatively underutilized TK energy attribute and evaluated its application on a seismic dataset from the Lower Magdalena Valley region in onshore northwest Colombia. The attribute proved effective in highlighting several gas-related anomalies, presenting them as localized and well-defined features.
Furthermore, integrating TK energy into the attribute set for SOM analysis produced promising results. The resulting facies classification displayed a clearer and more focused delineation of potential gas-related anomalies, in contrast to the more cluttered results obtained without TK energy.
These findings indicate that the TK energy attribute holds considerable potential for enhancing seismic interpretation, particularly in the identification of subtle anomalies and could offer valuable contributions in broader geophysical applications.
Acknowledgements
The first author gratefully acknowledges the Attribute-Assisted Seismic Processing and Interpretation Consortium at the University of Oklahoma for providing access to their software, which was utilized for all attribute computations. We also extend our thanks to the management of Canacol Energy Ltd. for granting permission to use the data presented in the illustrations included in this article.