
In Greek mythology, Argus Panoptes was the giant with a hundred eyes who never slept. It is a fitting image for what is now flying over the American West. A NASA ER-2 at 65,000 feet carries a spectrometer that records every pixel in roughly 425 wavelengths, and since 2023 it has imaged about 400,000 square miles of terrain in search of critical minerals. A hundred eyes seems modest by comparison.
The survey is impressive work, but a spectral image is not a mineral map, and a mineral map is not a discovery. Between the data and the decision sits a layer of expertise that most geoscience graduates were never taught, wrapped in software that most working geologists have never been able to run.
In my August column, “The Bedrock We Forgot,” I argued that economic geology is disappearing from university curricula one retirement at a time. This piece is about one small attempt to close part of that gap from the other direction: rather than waiting for the training to come back, make the tools easier to learn from. That attempt is a program I have been building called “Argus.”
A Survey Without Enough Readers
The Geological Earth Mapping Experiment, or GEMx, is a NASA and U.S. Geological Survey partnership funded through the USGS Earth Mapping Resources Initiative. It is, by the agencies’ own description, the largest airborne hyperspectral survey ever flown. Its newest instrument, AVIRIS-5, made its first flight in May 2025. It samples the solar-reflected spectrum from 380 to 2,500 nanometers at 5-nanometer intervals, more than doubling the 224 channels of the original AVIRIS that first flew in 1987. Its spectrometer is identical in design to EMIT, which has been mapping surface mineralogy from the International Space Station since 2022.
The standard tool for turning these spectra into minerals is Tetracorder, the expert system developed by Roger Clark and colleagues at the USGS. Rather than matching whole spectra statistically, it isolates diagnostic absorption features, removes the continuum, and works through a decision tree of rules derived from decades of laboratory spectroscopy. It can separate minerals whose features sit at nearly the same wavelength, such as calcite, epidote, and chlorite near 2.3 micrometers.
It is also hard to drive. Tetracorder is Fortran, run through command files and control scripts, on Linux. Its spectral library has to be convolved to the exact band centers and widths of the sensor in use; a library built for a different instrument still runs, but the fits quietly degrade. Its own user guide states plainly that a basic understanding of spectroscopy is required to use it well. For a student, a junior explorer, or a geologist who has spent a career in the field rather than at a terminal, the barrier to entry is the setup around the science rather than the science itself.
Building Argus
Argus is a desktop application, developed over the past two years, that takes a hyperspectral scene as it is downloaded and turns it into mineral maps a geologist can explore. It reads data from seven sources: AVIRIS Classic, AVIRIS-NG, AVIRIS-3, and AVIRIS-5, including the GEMx flights; NASA’s EMIT on the International Space Station, along with its L2B mineral products; and the Italian Space Agency’s PRISMA satellite. It starts with a double-click and runs in a web browser. Underneath, Tetracorder is left unchanged. Argus handles everything around it: ingesting each sensor’s files, matching the library to the sensor, managing the processing, and putting the results on a map with satellite imagery beneath them.
Before building anything, I looked for something that already did this. Commercial and open-source packages offer polished interfaces, but they identify minerals by spectral angle, statistical unmixing, or machine learning. None of them run Tetracorder’s rule-based expert system on airborne or orbital scenes.
Argus then builds on those identifications to produce maps that neither program makes on its own. Alteration maps group individual minerals into the zones an exploration geologist recognizes. Origin maps sort what has been found by the geologic process most likely to have formed it, so that hydrothermal alteration can be told apart from weathering products or the primary mineralogy of the host rock.
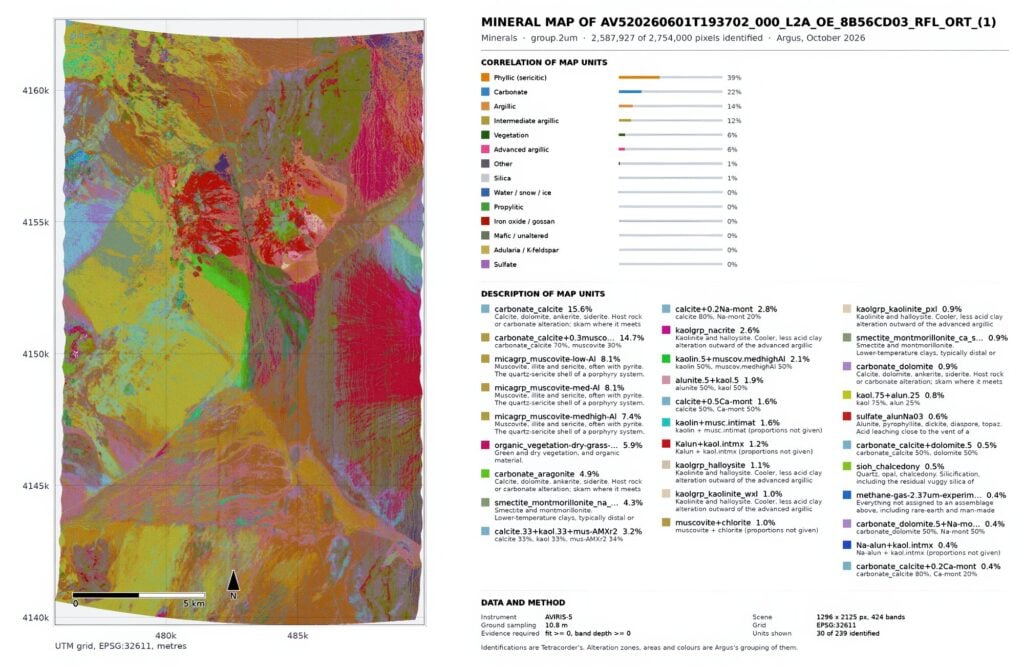
For each scene, Argus currently produces 613 material maps. Since nobody interprets 613 maps one at a time, Argus groups them into 15 alteration assemblages. These run from advanced argillic, argillic, intermediate argillic, phyllic, and propylitic zones to groups for iron oxide and gossan, ore minerals, adularia, silica, carbonate, sulfate, and mafic minerals, with vegetation and water kept separate (figure 1). A user reads zoning the way an exploration geologist thinks about a porphyry or epithermal system, rather than scrolling through 200 mineral names.
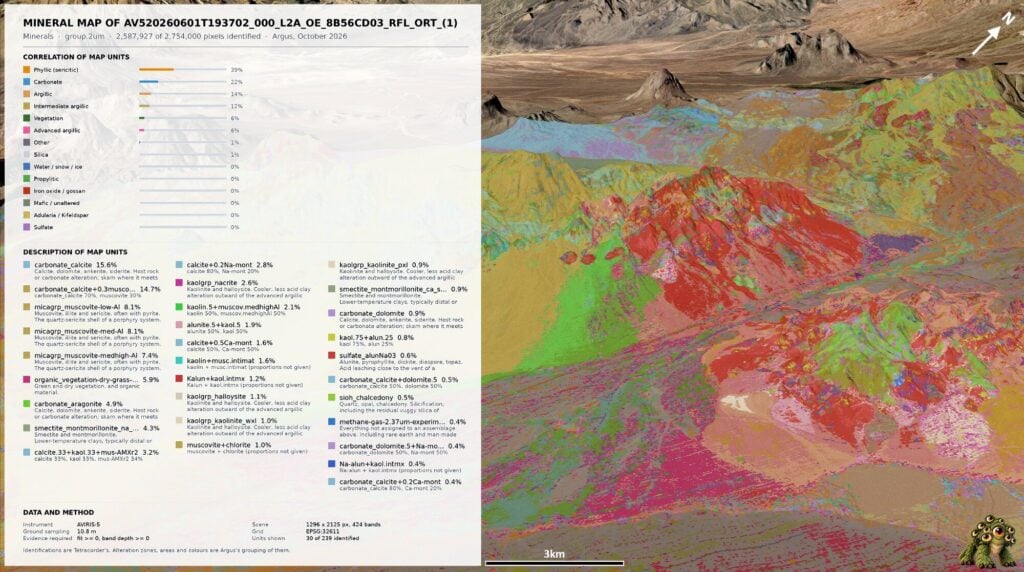
Results open as nine interactive layers: minerals, alteration zones (figure 2), band depth, fit, true color, geologic origins (figure 3), feature position, band ratio, and a combined two-group alteration map. Clicking any pixel shows its spectrum against the library reference, so the identification can be checked rather than taken on faith. Because a pixel several meters across is rarely a single mineral, Argus also reports the mixture in each pixel, listing the minerals that occur there together rather than a single best match. Drawing a polygon returns mineral proportions and area in hectares. Results export in a range of formats, including GeoTiff, png, map sheet, Word report, Google Earth and ENVI.
One of the first test cases was the Cuprite Hills in Nevada (figures 1-3), long the proving ground for alteration mapping from the air. Published USGS mineral maps of Cuprite give a benchmark to check against, so a new tool can be judged on ground whose answer is already well known. Argus has now passed its verification tests. After a successful round of alpha testing, it has moved into beta testing.
What the Software Cannot Do
This is where expertise comes back in. Argus can report that a pixel matches kaolinite, alunite, or a muscovite of a particular composition. It can show which minerals are mixed in that pixel. It cannot decide whether any of it matters. Desert varnish, transported cover, and vegetation all confound the signal. A zoned alteration pattern might mark the top of a porphyry system, or it might be a weathering artifact on a fault scarp. Only someone trained in deposit models can tell the difference.
A tool like Argus is meant to bring that judgment into a geologist’s education earlier, not to replace it. A student who can open a real scene, click on a pixel, and see why the software called it alunite is learning spectroscopy and alteration geology at the same time. That is a very different experience from reading about absorption features in a textbook, and a much cheaper one than a field season.
Building Argus also taught me something about the role of artificial intelligence in our discipline. I am a geologist who has been learning to code, and parts of this program were written with AI assistance. That help was useful, but the hardest problems were never solved by reasoning about what ought to be happening. I spent hours chasing a crash that turned out to be the program killing its own process. A full resolution run once quietly reused old results, because the check for whether a block had finished was satisfied by a folder that was nearly empty: the software equivalent of logging a hole that was never drilled. Each of those was solved by reading the log, not by accepting a plausible explanation.
AI can help, but it is not a scientist, and it will readily produce a confident answer when what was needed was to go and look. The same is true of any mineral map. Software can make an expert system easier to run; it cannot teach anyone when to doubt it.
Lowering the Barrier
Argus is a work in progress. The next steps are mosaicking adjacent flight lines, so a district can be read as one continuous map and refining spectral unmixing alongside Tetracorder. Where the two methods agree, confidence rises. Where they disagree is often where mixtures and weak signals hide, and those are the pixels a trained eye should examine.
A sister program, ExoArgus, is also in development. It carries the same approach to orbital imaging of the moon and Mars. Spectrometers in orbit have already mapped clays and sulfates across Mars and signs of hydration on the moon, and the question of what resources lie at those surfaces is moving from pure science toward planning. The challenge there is familiar: the data exists, and the number of people equipped to interpret it is small.
In practice, that means short courses built around GEMx scenes over districts that have already been drilled and described; open, maintained front ends to established expert systems, shared between institutions rather than rebuilt in isolation; pairing airborne maps with core, hand samples, and field checks, so that students learn to question a map before they trust it; and counting the software that makes agency data usable as scholarly work rather than a side project.
As with the curriculum changes in my earlier report, none of this is radical. It is upkeep, and it is what keeps a large public investment in data from going unread.
Conclusion
The United States is spending real money to look at its own ground more closely than ever before, and the instruments are equal to the task. AVIRIS-5 does not blink and does not sleep. But the giant in the myth was eventually lulled into closing his eyes, and the risk here is quieter. The data will keep arriving whether or not enough people know how to read it.
Mineral maps do not find deposits. Geologists do, using maps they understand well enough to doubt. If we want the largest hyperspectral survey in the nation’s history to pay off, we have to put its tools in front of the next generation now, while there are still experienced people to teach them. Otherwise, the West will be mapped in extraordinary detail, and the maps will sit unread.