
Structural evolution and sedimentary architecture are typically treated as separate aspects of basin development – normally discussed in different sections of a paper or separate sessions at a conference. In practice, the two evolve together. Faulting creates accommodation and modifies basin topography, submarine channels respond to those changing conditions, and later deformation can modify sediment deposited earlier. These relationships are fundamental to petroleum systems, yet they are rarely visible within a single seismic display.
Study Area
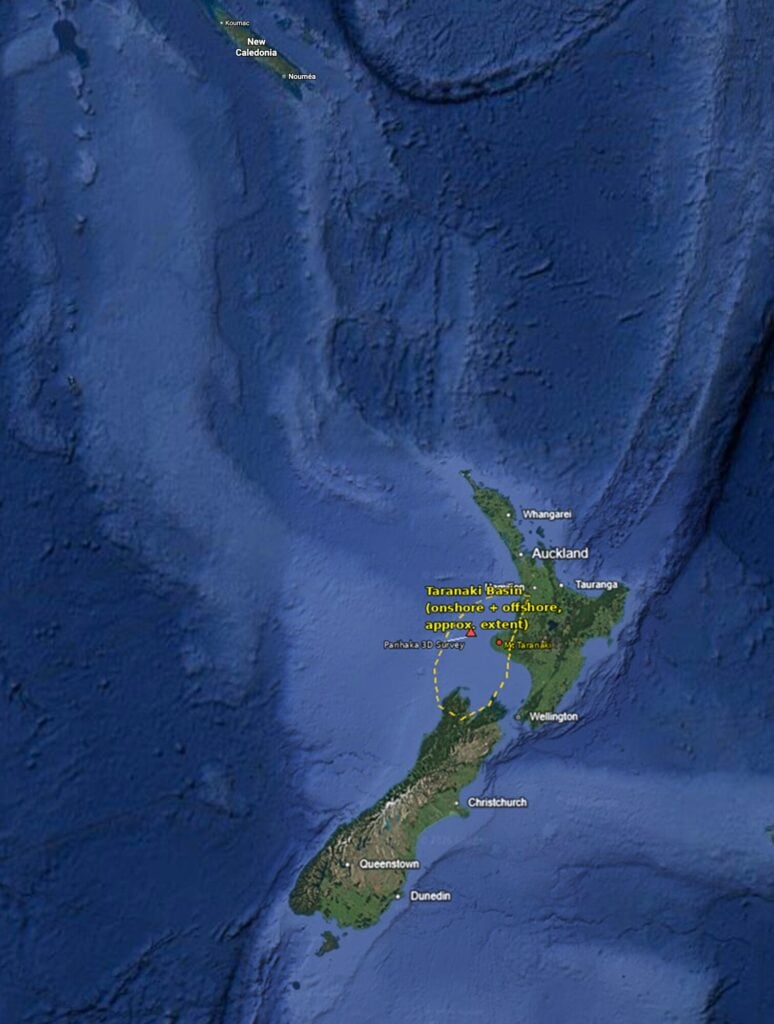
The study area lies in the northern offshore portion of the Taranaki Basin, one of New Zealand’s most prolific hydrocarbon provinces. Following Mesozoic rifting and subsequent thermal subsidence, Miocene deepwater sedimentation produced extensive submarine channel systems, levees, and slope deposits. Later tectonic reactivation modified portions of these systems, preserving a detailed record of the interplay between sedimentation and deformation.
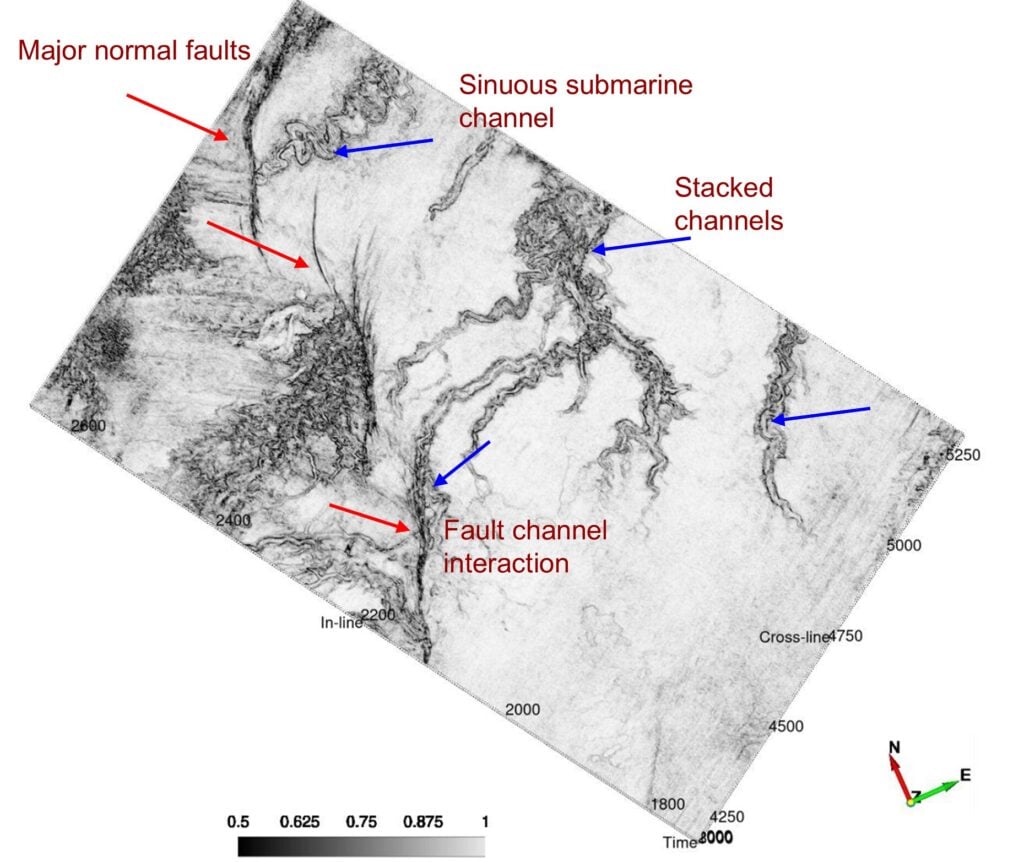
A series of major normal faults defining the basin’s structural framework dominates the western part of the survey. The eastern part is characterized by highly sinuous submarine channels that branch, migrate, and locally stack. The transition zone between the two is the most diagnostic part of the image: several channels approach or intersect fault zones, where their geometry changes upon contact. This suggests that structural relief influenced sediment pathways, whereas subsequent fault movement modified parts of the pre-existing channel architecture.
Attribute
The similarity attribute was computed using a symmetric 20-millisecond analysis window, selected after testing a range of shorter and longer windows on this dataset. The 20-millisecond window provided a practical balance between vertical resolution and noise suppression, retaining the main structural and stratigraphic features while reducing noise and artifacts observed with shorter windows. Longer windows provided greater smoothing but at the expense of vertical resolution and detail.
A dense set of geological horizons was generated, guided by a steering cube that captures the local dip and azimuth of the reflectors. The already computed similarity volume was then extracted along each of these closely spaced horizons, allowing the resulting coherence values to be viewed and sliced interactively along the structural framework that the horizons define, rather than only along flat time slices.
Visualizing Structure and Stratigraphy
An annotated similarity-attribute horizon slice from the Parihaka 3-D survey, in the offshore Taranaki Basin, New Zealand, makes that relationship explicit across the full survey area. Figure 2 shows major normal faults defining the structural framework to the west, a sinuous submarine channel and its stacked channel complexes to the east, and the point where the two systems meet – namely, structure and stratigraphy, marked directly on a single plan-view display.
The significance of figure 2 lies in the combination itself: structural framework and depositional architecture, ordinarily interpreted separately across multiple sections and attribute maps, appear together in a single similarity-attribute display spanning the full survey. Seeing the major normal faults, the channel system, and the point where they meet within a single image provides a clear framework for analyzing the relationship between deformation and sedimentation.
Figure 2 identifies these elements directly. The major normal faults defining the basin’s structural framework are marked to the west; the sinuous submarine channel and its stacked channel complexes are marked to the east, recording repeated episodes of deepwater sediment transport; and the fault-channel interaction zone is marked where the two systems meet – the point where depositional pathways intersect structural deformation. Further to the east, an isolated, highly confined channel segment demonstrates the baseline depositional style of the basin floor away from structural disruption, channel complexes, or major sediment staging areas.
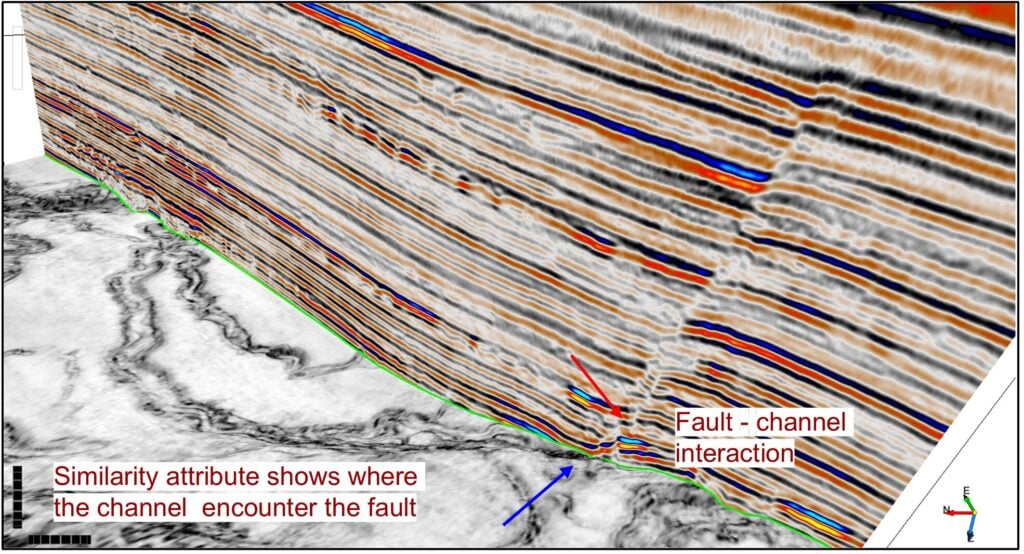
Figure 3 confirms the interaction at the scale of individual reflectors. It ties a vertical seismic section directly to the similarity-attribute horizon slice at the point marked in figure 2: the seismic section preserves reflector character and stratal geometry, while the attribute slice below it reveals the plan-view pattern of the channel and fault. Where the two elements meet, a fault trace and a channel margin coincide directly beneath a visible break in reflector continuity – the seismic and attribute expressions of the same structural-stratigraphic interaction, shown side by side rather than inferred across separate displays.
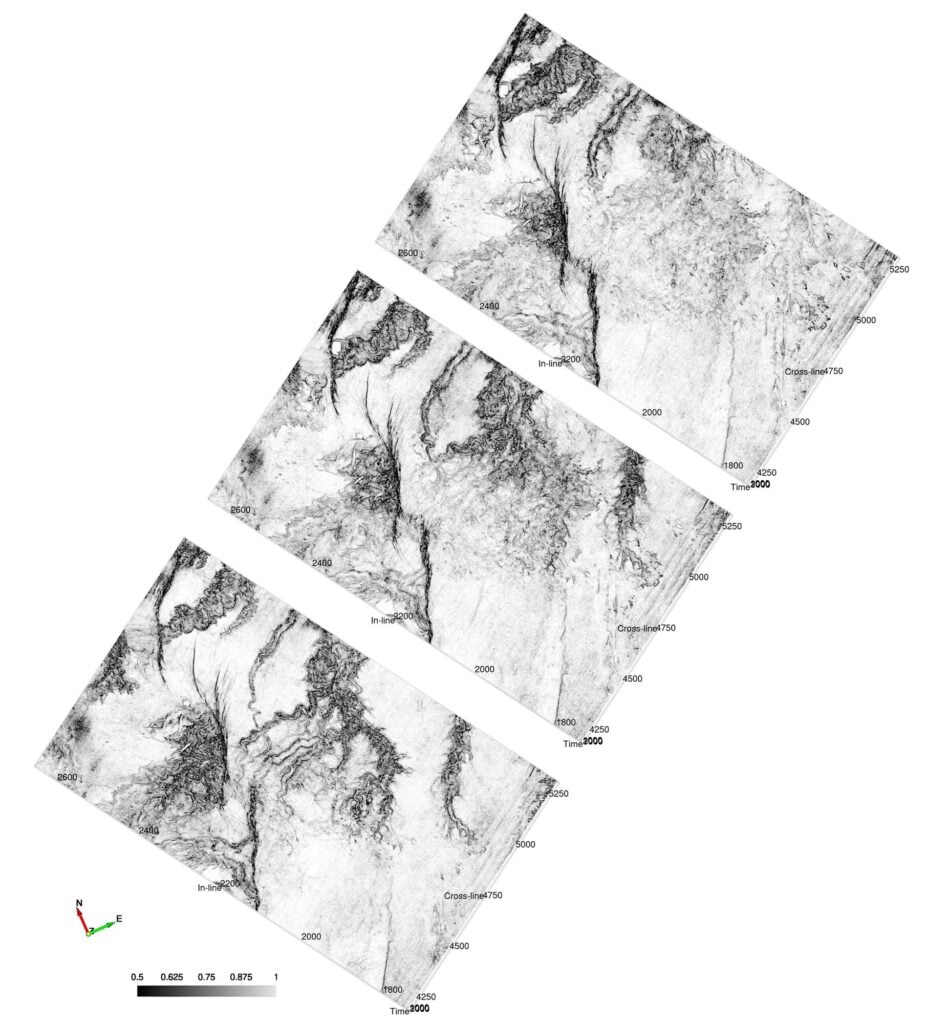
This interaction did not appear all at once. Figure 4 shows three earlier horizon slices from the same volume, arranged from bottom (oldest) to top (youngest) to mirror their actual stratigraphic order, demonstrating how the relationship in figures 2 and 3 developed through the section. Previous mapping of this same dataset indicates that the older channel complexes developed from roughly 4.5 to 3 Ma, whereas the youngest unit formed around 2.5 Ma and is directly syntectonic with one of the Parihaka Fault segments. Because this horizon represents the youngest, shallowest interval in the dataset, the features in figures 2 and 3 likely lie within that same general interval, though no direct horizon tie was made here to confirm it.
Whether the deeper relationships in figure 4 reflect earlier syndepositional activity, later reactivation, or both is difficult to determine from the attribute alone, but the link between faulting and channel behavior persists through the section, becoming most pronounced toward the top in the relationship shown in figures 2 and 3.
Significance
The implications extend beyond fault or channel mapping in isolation. The spatial relationship between deformation and sediment dispersal controls accommodation space, channel confinement, reservoir connectivity, seal integrity, and ultimately trap development. Visualizing structural and stratigraphic elements within a single display, as in figures 2 and 3, consolidates information that would otherwise be spread across multiple sections, horizon slices, and attribute maps into a single view, facilitating efficient interpretation.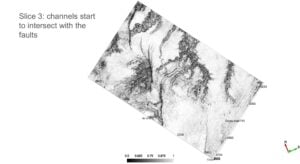
Similarity attributes have been applied well beyond this kind of channel-and-fault mapping, from fault and discontinuity interpretation to fracture detection in unconventional reservoirs for completion design. In mature exploration provinces such as Taranaki, where subtle structural and stratigraphic traps commonly coexist, this same versatility can improve interpretation efficiency and strengthen confidence in the resulting geological model.
The significance of figures 2 and 3 lies not in the attribute itself but in the geological history they record. Figure 4 allows that history to be traced as the channel system develops across the survey and progressively interacts with the fault network; Figures 2 and 3 represent the stage at which that interaction is most fully expressed – first across the full survey in plan view, then confirmed directly against seismic character. Together, they illustrate how a small set of complementary displays, instead of numerous seismic sections and attribute volumes, can capture an evolving structural-stratigraphic relationship directly.
Acknowledgments
The Parihaka 3-D seismic dataset used in this study was made publicly available by the New Zealand government (New Zealand Petroleum and Minerals), and its release is gratefully acknowledged. OpendTect (dGB Earth Sciences) was used to compute, interpret, and visualize the similarity-attribute volume presented here.