


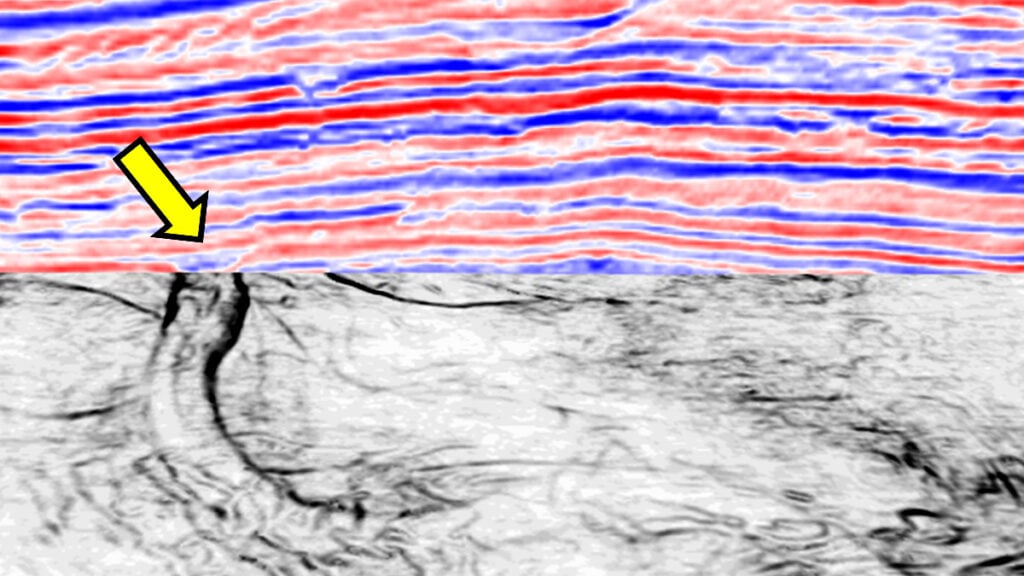
The Teager-Kaiser energy attribute has previously been shown to enhance the detection of localized seismic energy anomalies associated with hydrocarbons. In what follows, we introduce the related Teager-Kaiser variation attribute, obtained by applying a negative Hilbert transform to the TK energy attribute, and demonstrate its application to 3-D seismic datasets from the Taranaki Basin, New Zealand. The TKV attribute exhibits a lower dominant frequency than the original seismic data, emphasizing broad variations in instantaneous energy that enhance stronger geological features rather than individual reflections. Through applications to shallow gas anomalies, subsurface channels, and fault systems, we show that the TKV attribute improves the delineation of anomaly boundaries, channel geometries, and fault lineaments. Energy-ratio coherence and fault-likelihood attributes computed from the TKV volume consistently provide sharper and more laterally continuous images than those derived from the original seismic amplitude data. These results demonstrate that the TKV attribute is a valuable addition to the seismic interpreter’s toolbox for enhancing subtle stratigraphic and structural features and improving subsurface interpretation.
Introduction
We introduced the Teager-Kaiser energy attribute and its applications to a seismic dataset from the Lower Magdalena Valley in onshore northwest Colombia in the October 2025 issue of the Geophysical Corner. Our results indicated that TK energy effectively highlights gas-related anomalies, revealing them as localized and well-defined features. Additionally, by incorporating TK energy into the attribute suite used for self-organizing mapping analysis in unsupervised seismic facies classification, promising outcomes were seen. The resulting facies display exhibited a much clearer delineation of gas-related anomalies compared to the more cluttered results obtained without TK energy. We therefore concluded that the TK energy attribute is a valuable addition to the seismic interpreter’s toolkit, with strong potential for identifying hydrocarbon reservoirs in this and similar geological settings.
Here, we first describe the related Teager-Kaiser variation attribute and then highlight its applications to seismic data.
AVT Attribute
The amplitude volume transform attribute has proven effective in enhancing the visibility of subsurface features compared to conventional seismic displays, thereby facilitating interpretation. It is a two-step process. In the AVT, the root mean square amplitude is first calculated using a sliding window along each seismic trace – this involves squaring the amplitude values, averaging them within the window, and taking the square root. Because squaring and averaging operations are nonlinear, this operation not only renders all amplitudes positive, but also alters the frequency spectrum, decreasing the higher frequency and adding lower frequencies. Second, a -90-degree phase rotation is applied using the Hilbert transform, resulting in dual-polarity data. The Hilbert transform of the RMS amplitude will be maximum where the RMS amplitude changes rapidly, thereby delineating the change from high-amplitude to low-amplitude reflection packages. This transformed data can be directly compared to the original seismic amplitude volume, offering an alternative perspective that highlights key features more effectively.
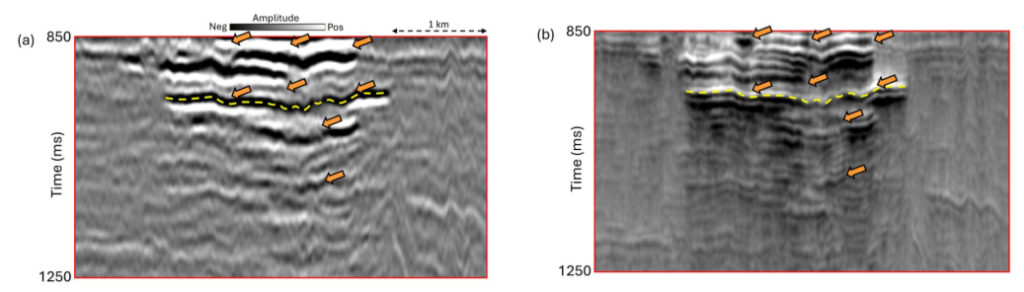
Figure 2a displays a vertical slice from the input seismic data volume, flattened on a marker near 750 milliseconds, the interval below which corresponds to the broad zone of interest. In contrast, figure 2b shows the equivalent AVT slice, where seismic reflections appear more pronounced. The enhanced, embossed appearance of the reflections not only makes them stand out more clearly but also accentuates the faulting they have undergone, aiding in structural interpretation.
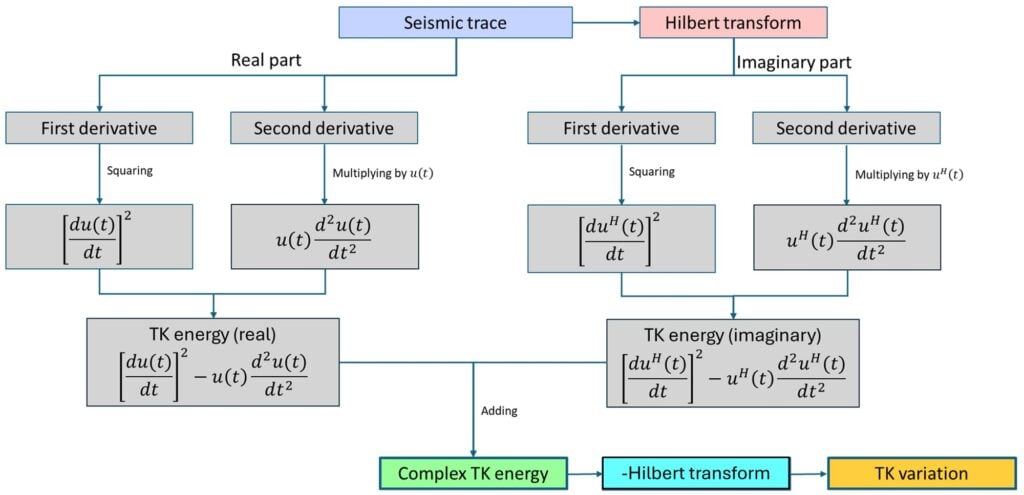
Inspired by the AVT attribute, our second author applied the negative Hilbert transform (cyan box) to TK energy attribute (cyan box) in figure 1 to obtain the TK variation attribute (yellow box).
TKV Attribute Applications
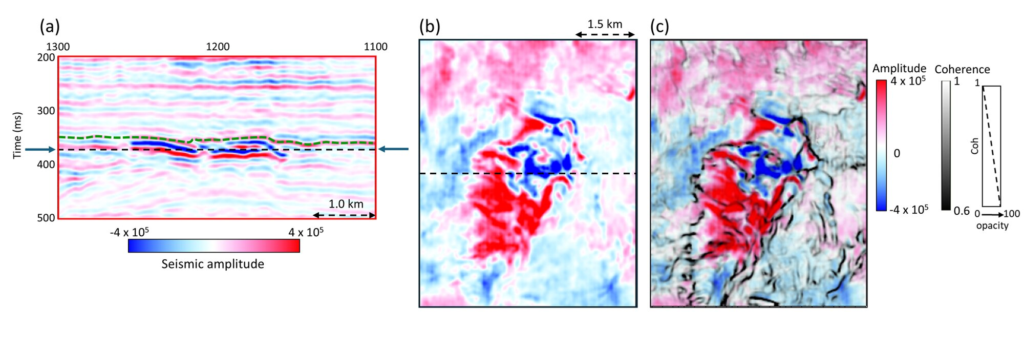
(b) Time slice at t=380 milliseconds, marked by the dashed line in (a), extracted from the input seismic volume and illustrating the spatial extent of the anomaly. Since the amplitude anomaly observed in (a) appears irregular and discontinuous rather than smooth, the time slice was co-rendered with energy-ratio multispectral coherence, as shown in
(c). The black lineaments delineate the boundaries of the gas anomaly as well as other discontinuities within and surrounding the feature. The green horizon in figure 2a is more continuous (and easier to pick than the nearby bright spot). Data courtesy of New Zealand Petroleum & Minerals.
In the October 2025 Geophysical Corner, we showed how the Teager-Kaiser energy attribute provides more localized and distinct estimates of instantaneous energy due to its sensitivity not only to amplitude variations but also to frequency changes. Figure 1 presents the workflow used to compute TK energy (green box in the workflow) from preconditioned seismic data.
Bright spot anomalies: Hydrocarbon anomalies, particularly shallow gas accumulations occurring in unconsolidated sediments in regions such as the Gulf of Mexico (America), the Barents Sea, and the Taranaki Basin, among others worldwide, can often be readily identified on far-angle seismic stacks. A comparison of the near-, far-, and full-angle stacks from the Pipeline 3D seismic survey acquired in the Taranaki Basin, New Zealand, clearly demonstrates the amplitude variation associated with a shallow hydrocarbon anomaly (see the April 2023 Geophysical Corner).
We illustrate the application of TK variation attribute on a shallow bright spot anomaly on the Pipeline 3D dataset (figure 3). This dataset includes a seismic section segment highlighting a high-amplitude anomaly associated with gas (figure 3a). It also features a 380-millisecond time slice extracted from the seismic volume (figure 3b) and the corresponding 380-millisecond time slice co-rendered with the energy ratio coherence attribute (figure 3c). The spatial distribution of the high-amplitude anomaly (displayed in red) appears irregular and discontinuous in places. In contrast, the co-rendered display provides a more convincing representation, with the high-amplitude zones being clearly bounded by low-coherence lineaments, while additional discontinuities are also highlighted elsewhere in the section.
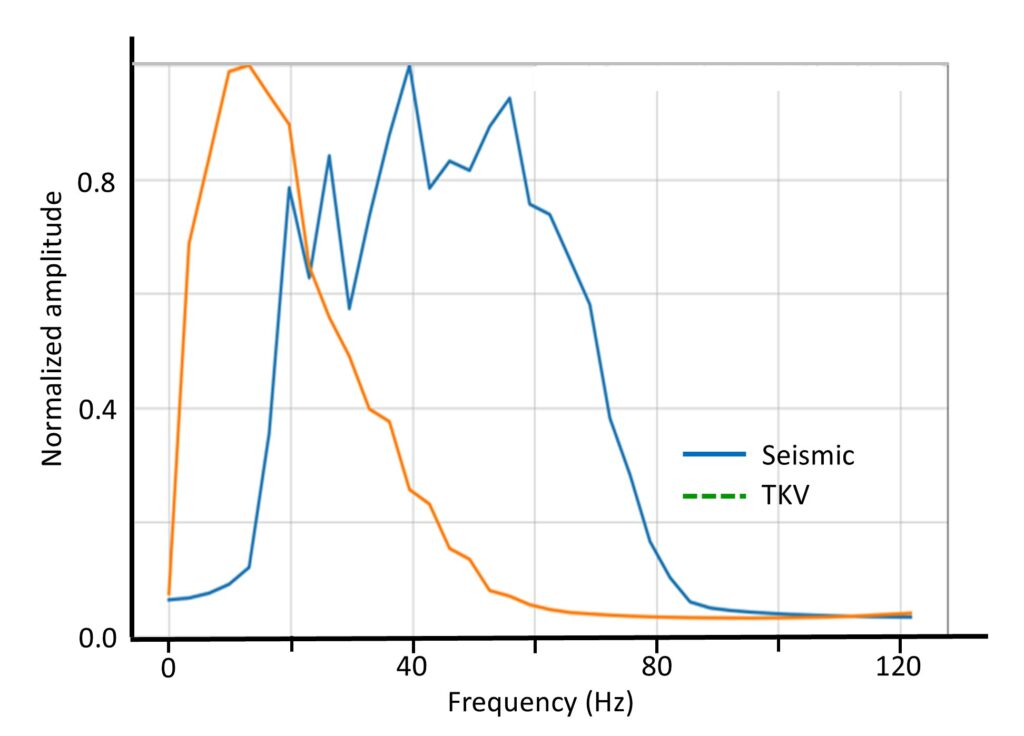
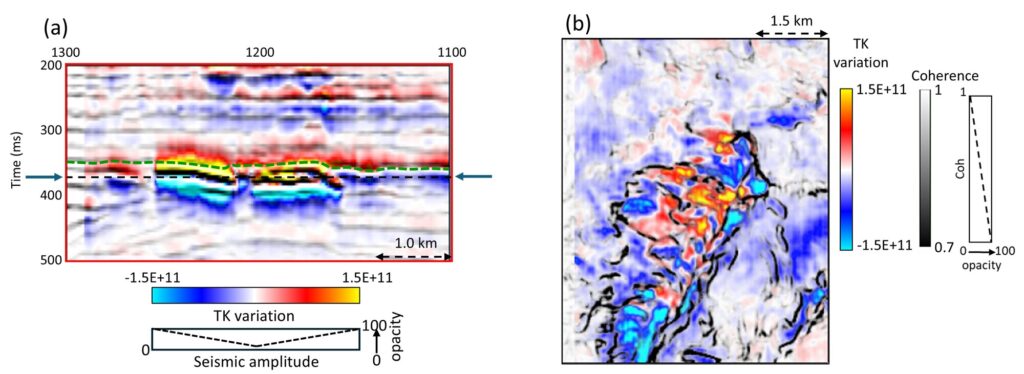
Figure 4a shows a segment of the TKV attribute volume computed from the seismic data shown in figure 3 and co-rendered with the seismic section in grayscale. The bright amplitude anomaly is interpreted as a possible gas accumulation. Figure 4b exhibits a time slice at 388 milliseconds extracted from the co-rendered volume of the TKV attribute and multispectral energy-ratio coherence. Because the TKV attribute is shifted by –90 degrees in phase relative to the original seismic data, the 372-milliseconds slice is equivalent to the 380-milliseconds slice shown in figure 3c. The black lineaments delineate the boundaries of the gas anomaly as well as other structural discontinuities within and surrounding the feature. Noticeably, the TKV attribute (in color) shows more variation within the bright amplitude anomaly than the seismic amplitude in figure 3c, which could be helpful in interpretation.
Comparison of the amplitude spectra of the seismic and TKV attribute volumes over the 200 to 500-milliseconds interval in figure 5 shows that the TKV attribute exhibits a lower dominant frequency than the original seismic data and contains significant energy below 15 hertz, where the seismic spectrum has little or no energy. This behavior is expected because the Teager-Kaiser variation is a nonlinear, energy-based attribute that tracks the spatial variation of instantaneous energy rather than the seismic waveform itself. The nonlinear energy estimation and differencing processes generate slowly varying modulation components, resulting in enhanced low-frequency content while suppressing higher-frequency oscillations. Consequently, the TKV attribute emphasizes broad energy variations associated with geological features such as gas accumulations and structural discontinuities rather than individual seismic reflections. Our second author has suggested in an earlier presentation that application of coherence and curvature on TK energy and variation attributes could display better definition of discontinuities such as channel edge or faults. Having demonstrated the attribute’s ability to characterize bright spots, we next examine whether it also enhances the imaging of stratigraphic features.
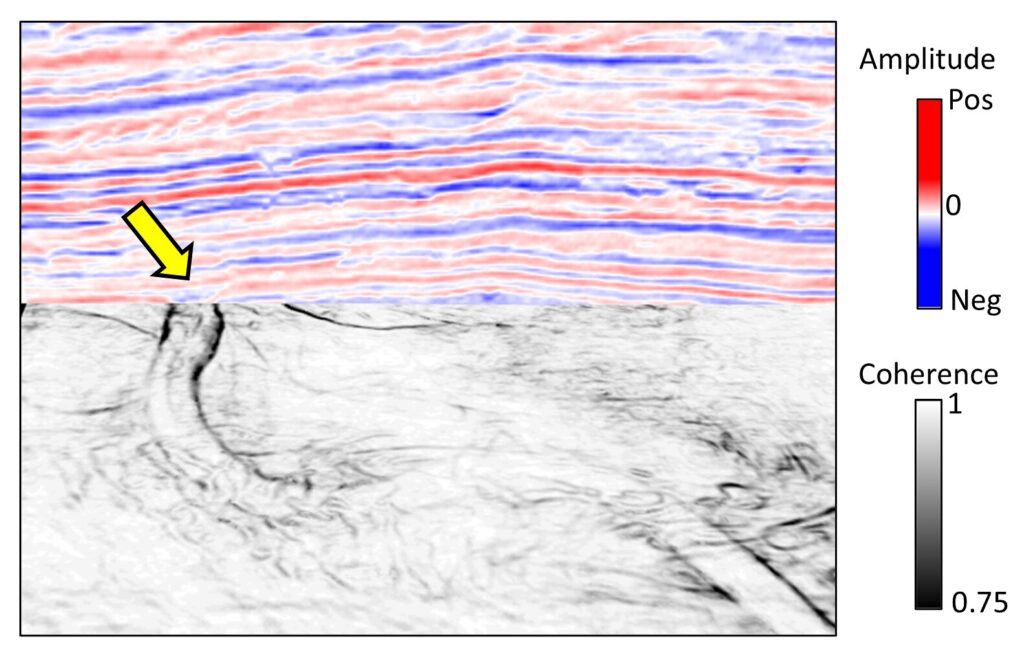
Subsurface channel features: To illustrate the computation of energy ratio coherence on TKV attribute and compare it with the energy ratio coherence computed on seismic data, we again used the Pipeline 3D seismic data volume as it exhibits paleo channels at deeper times. Figure 6 shows a chair display showing a vertical seismic section correlated with a horizontal time slice extracted from the energy-ratio coherence volume. The yellow block arrow highlights the seismic expression of the channel, whose boundaries are clearly delineated on the coherence attribute.
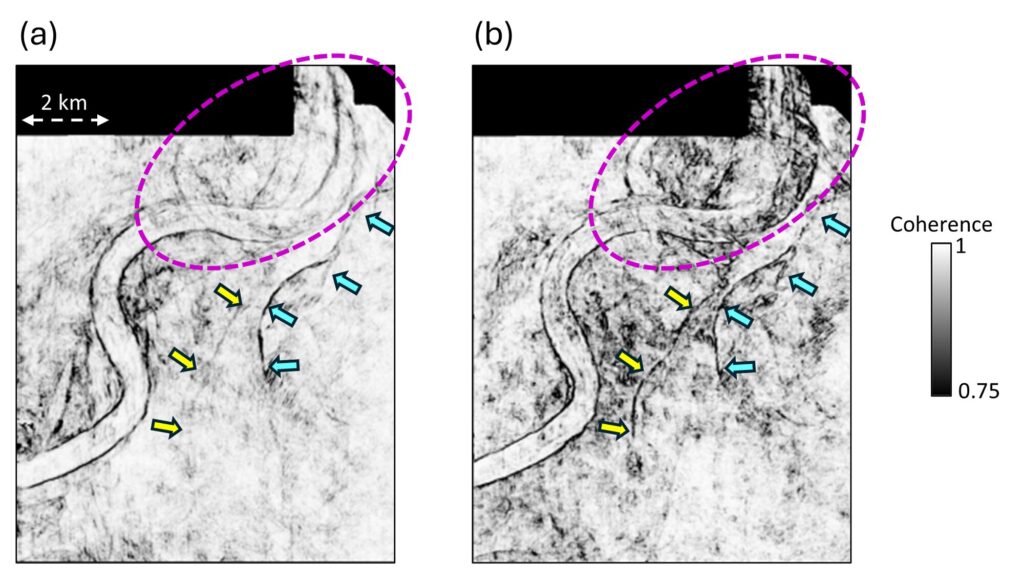
Figure 7 shows a comparison of horizon slices extracted from the energy ratio coherence computed on the seismic data volume (figure 6a) and the TKV attribute (figure 6b) and are 124 milliseconds above a flattened marker. Notice the boundaries indicated by the colored arrows that are obtained from the original seismic data, seen as more distinct and continuous on the display in figure 7b.
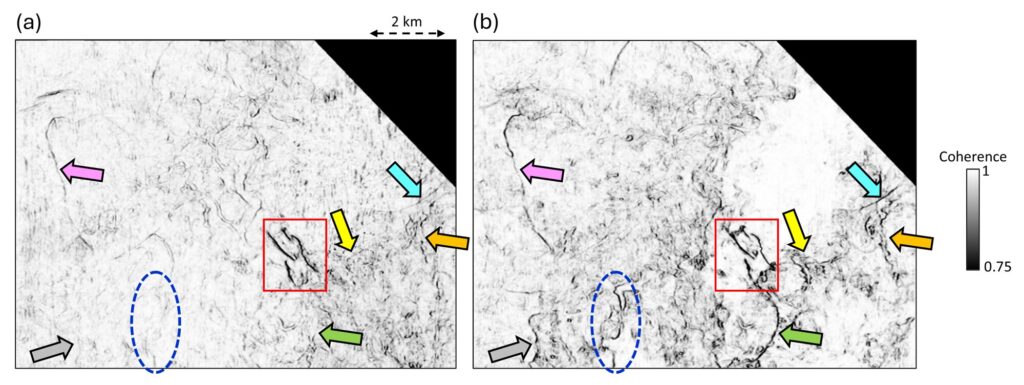
Likewise, figure 8 exhibits a comparison of horizon slices extracted 32 milliseconds above a flattened marker (at approximately 2,300 milliseconds) from the energy-ratio coherence volumes computed on the original seismic data (figure 8a) and the TKV attribute (figure 8b) reveals noticeable differences in the delineation of structural discontinuities. The coherence volume derived from the TKV attribute exhibits boundaries that are sharper, more distinct, and laterally more continuous than those, as indicated by the colored arrows. In particular, the pair of northeast/southwest-trending discontinuities enclosed within the red box are interpreted as localized faults, which are more clearly resolved on the coherence display derived from the TKV attribute.
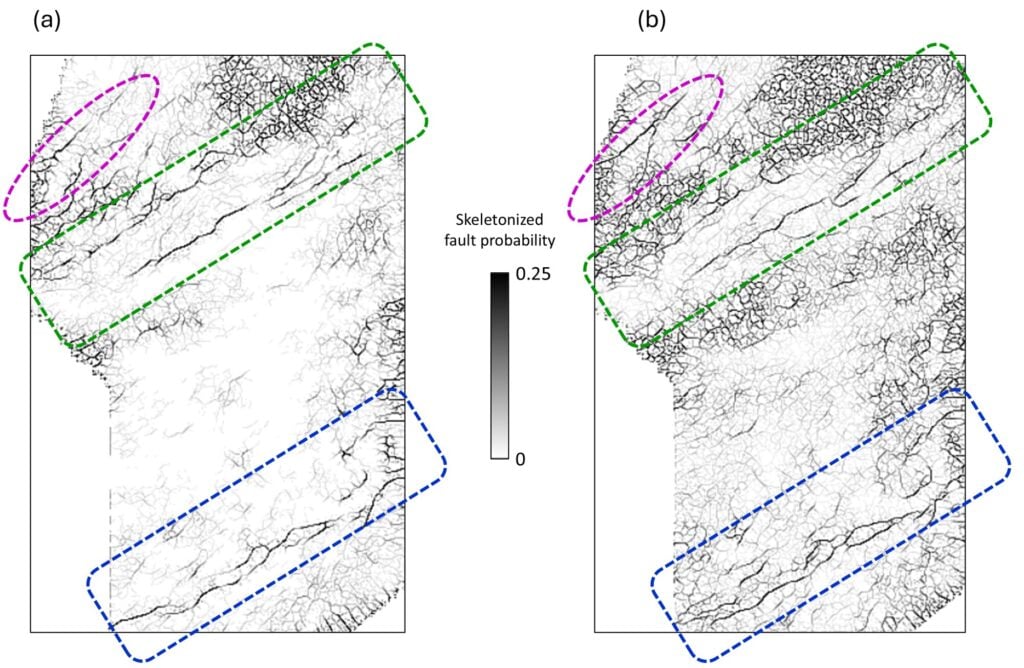
Fault lineaments: The Kaimata 3-D is located in the Taranaki region on the north island of New Zealand and was acquired in March of 2003. The final prestack time-migrated data has a bin size of 25-by-25 meters, sample rate of 2 milliseconds, and record length of 5 seconds. We picked up this data volume for generation of attributes including TKV, energy ratio coherence, and fault likelihood.
Figure 9a shows a comparison of time slice displays at 2,682 milliseconds through the skeletonized fault probability attribute generated on multispectral energy ratio coherence run on the original seismic volume, and the equivalent skeletonized fault probability attribute generated on TKV attribute is shown in figure 9b. The fault probability lineaments in (b) are sharper and more laterally continuous than those in (a), with several prominent differences highlighted by the dashed polygons.
Thus, rather than replacing conventional coherence or fault probability attributes, the TKV attribute serves as an enhanced input volume from which these attributes can be computed, yielding more continuous and interpretable discontinuity images.
Conclusions
The Teager-Kaiser variation attribute extends the capabilities of the previously introduced TK energy attribute by providing a complementary view of seismic data that emphasizes variations in instantaneous energy rather than the seismic waveform itself. Our examples demonstrate that the TKV attribute enhances the delineation of gas-related bright spot anomalies, reveals greater internal variability within hydrocarbon accumulations, and improves the definition of subtle structural and stratigraphic discontinuities. When used as the input for energy-ratio coherence and fault-likelihood attributes, it yields sharper, more continuous channel boundaries and fault lineaments than those derived from the original seismic data. The observed shift toward lower-frequency content is an inherent consequence of the nonlinear energy-based formulation and contributes to the enhanced imaging of geological features. These results suggest that the TKV attribute is a valuable addition to the interpreter’s attribute suite and can improve the visualization and interpretation of hydrocarbon anomalies, channels, faults, and other subtle subsurface features.
Future work should evaluate the performance of the TKV attribute on carbonate reservoirs, fractured reservoirs, thin-bed stratigraphy, and machine-learning workflows where enhanced input attributes may improve classification accuracy.
Acknowledgements: The first author gratefully acknowledges the Attribute-Assisted Seismic Processing and Interpretation Consortium at the University of Oklahoma for providing access to their software, which was used for all attribute computations in this study. The data for the Pipeline 3-D and Kaimata 3-D seismic volumes are courtesy of New Zealand Petroleum and Minerals.