
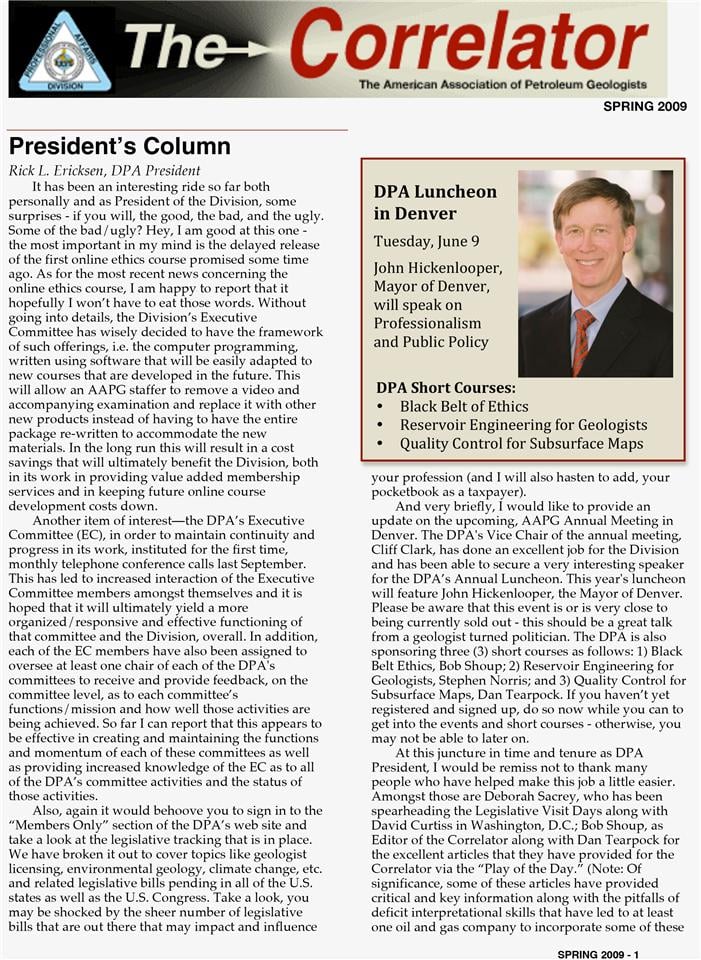
Over the past 25 plus years, I have been amazed at how many people are not aware of the proper thicknesses derived from well log data that is required to generate a net sand and net pay map for volumetric calculations. In performing various quizzes around the world to thousands of geoscientist and engineers, the statistical average of people who get the correct answers on these types of quizzes runs about 50%. When trying to determine which thickness, within a pay zone of an oil or gas reservoir, is correct in order to generate a net pay isochore map for volumetric calculations, based on a structure map of the reservoir, one cannot afford to make mistakes. The wrong thickness calculations have lead to both over and underestimations of hydrocarbons in-place, recoverable hydrocarbons and reserves. Some have resulted in significant overestimations of reserves, which in certain cases has caused serious internal economic problems, as well as government reporting problems, not to mention litigations.
A geological situation containing dipping beds and directionally drilled wells, can be complex and confusing to understand. However, the understanding and application of the correct data can be vital to a new discovery or development of a mature field. In one actual case, as an example a company had 5 development wells on their drilling calendar. The wells were planned because a volumetric vs performance analysis indicated that certain reservoirs had greatly under produced the recoverable hydrocarbons. A third party review of the data showed that the company personnel had used the wrong thicknesses from the wells to calculate their in-place and recoverable hydrocarbons. When the correct thicknesses were used and net pay isochore maps made, the volumes were greatly reduced and matched the performance data. This reevaluation saved the company the cost of drilling 5 expensive and unnecessary development wells.
Thickness Determinations for Volumetric Calculations
True vertical thickness (TVT) is the thickness of an interval measured in a vertical direction. It is this thickness that is required to accurately count net effective reservoir quality rock (e.g. sand). It is this thickness that is also used to construct net pay isochore maps for volumetric calculations.
In a vertical well, the actual thickness measured on the electric log is the TVT. In the case of a directionally drilled well, however, a correction factor is often required to correct the exaggerated or diminished measured log thickness (MLT) due to the nature of the deviated wellbore and dipping beds.
For a horizontal reservoir (zero bed dip) the geology is simple; the thickness that is used for net reservoir quality rock or net pay isochore mapping equals the true stratigraphic thickness (TST) which in this case is also equal to TVT. However, if the same reservoir is rotated to some angle, such as 20 deg, the thickness of the reservoir required to determine net reservoir quality rock and for net pay isochore mapping is no longer equal to the true stratigraphic thickness.
Figure 1 illustrates the cross-sectional area of a reservoir with a fixed width in the third dimension. I use the cross section to represent the volume of a reservoir. The horizontal reservoir (zero bed dip) in the lower portion of the figure has a cross-sectional area of 50,000 sq ft. The reservoir has a length of 500 ft, as seen in map view, and a thickness of 100 ft. Since the dip of the reservoir is zero, the TVT, which equals the TST, is equal to 100 ft. If the same reservoir rotates to an angle of 45 deg, as shown in the upper portion of the figure, the length of the reservoir shortens to 354 ft in map view, such as depicted from a structure map. The cross-sectional area of the reservoir has not changed, as the TST remains 100 ft. thick. In order to map the reservoir and maintain a cross-sectional area of
50,000 sq ft, the thickness used must exceed 100 ft. The TVT of the dipping reservoir measures 141.25 ft, and so 141.25 ft x 354 ft = 50,002.5 sq ft. From this example, one can see that as a reservoir of fixed length rotates from the horizontal, the projected areal extent of the reservoir decreases in map view. Therefore, in order to maintain the same cross-sectional area or volume of a reservoir, the shortened length must be multiplied by the True Vertical Thickness of the reservoir rock (TVT).
For directionally drilled wells the situation becomes more complex. The log thickness of a given stratigraphic interval can be thicker than, equal to, or thinner than that seen in a vertical well drilled through the same stratigraphic section. A correction factor must be applied to the MLT in most deviated wells to convert the borehole thickness to TVT. The correction factor consists of two parts: (1) the correction for wellbore deviation angle within the interval of interest, and (2) the correction for bed dip. In the textbook “Applied Subsurface Mapping with Structural Methods” 2nd edition (2003) several sections of the text address this important subject.
Equation 1 shown here is a 3D equation and is considered the preferred correction factor equation because this one equation can be used to calculate the thickness correction factor regardless of the direction of wellbore deviation, and it uses the true dip of the beds instead of the apparent dip required in two-dimensional equations. We refer to this equation as “Setchell’s” equation.
If the beds are horizontal, the tangent of 0º dip is 0, therefore Setchell’s equation reduces to the simple correction factor (Equation 2) which is equivalent to correcting for wellbore deviation only, yielding a True Vertical Thickness, which in this case is also equal to True Vertical Depth (TVD) thickness.
Let’s now consider two directionally drilled wells shown in Fig. 2. Look first at the well drilled to the east in a down-dip direction (Fig. 2a). Consider the interval to be a reservoir filled with gas or oil. The well drilled in a down-dip direction has a MLT of 476 ft. which exceeds the TVT. We first apply the correction factor for wellbore deviation only, using Eq.(2). The MLT reduces to 357 ft, shown in the figure as the TVD thickness, or the true vertical depth thickness (TVDT). This thickness also exceeds the TVT of the interval, because the correction for only wellbore deviation does not take into account the dip of the beds. The TVDT is that thickness of an interval obtained from a true vertical depth (TVD) log. For dipping beds, TVDT does not equal TVT. With the final correction for bed dip, the MLT converts to a TVT of 150 ft, shown in Fig. 2a at the penetration point of the wellbore in the top of the reservoir. Note that the TST is 123 ft.
The TST can be calculated by multiplying the TVT by the cosine of the angle of bed dip (35 deg in this example). The TST cannot be used for volumetric calculations for dipping beds. It will underestimate the volumetric in-place and recoverable hydrocarbons.
The well in Fig. 2b deviates up-dip, to the west. The MLT for this well of 127 ft is now less than the TVT. Applying a correction factor for the well deviation angle alone, which is equivalent to a correction to TVDT, provides an even smaller thickness of 82 ft. When Eq.(1), the correction factor equation for both bed dip and wellbore deviation, is applied, the MLT converts to a TVT of 150 ft. This is the thickness needed for net sand and net pay mapping, as well as volumetric calculations and reserves.
Various computer programs can be used to create TVD, TVT, and TST logs from measured depth (MD) logs for use in mapping. The deviated well log data, the directional survey for the well, and bed dip information are necessary as input data. The log data are obtained from a logging company tapes or digitized from the actual log. The directional survey data can be furnished by the directional company that worked the well. The bed dip information can be obtained either from completed structure maps or from a dipmeter log. The output logs can be in standard presentation or at any scale desired.
We caution here that TVD logs, which are usually a standard part of the log suite for a deviated well, are too often used for purposes for which they are not applicable. A widespread misunderstanding exists that a TVD log prepared from a MD log can be used to (1) correlate with other well logs, (2) determine the vertical separation (missing or repeated section) for a fault, and (3) count net reservoir quality rock (e.g. sand) and can be used to determine net pay to prepare net pay isochore maps. Remember, a TVD log is generated by correcting for wellbore deviation only, and not bed dip. In areas of flat-lying beds, a TVD log is equivalent to a TVT log because the only correction factor required is for wellbore deviation (Fig. 3).
However, if the beds are dipping (particularly over 10 deg), a TVD log typically does not represent the log thickness required to aid in correlation work, to determine the vertical separation for a fault, to count net sand or net pay or to construct net pay isochore maps. For these purposes, we must correct a deviated well log so that the log thickness represents the TVT. Look again at Fig. 2 and observe the significant differences in thickness between the TVD and the TVT values. To determine net sand and net pay from a deviated well log, we must use a TVT log or its equivalent. By the equivalent of the TVT log, I mean calculating and using correction factors for specific intervals of interest, if a TVT log is unavailable, which is commonly the case. Therefore, for each interval on the deviated well log requiring the conversion of MLT to TVT, determine the appropriate correction factors and apply them to the MLTs for the intervals of interest.
The Impact of Correlation Factors
Over the past 25 years I have seen significant errors in resources and reserves calculations as a result of someone using the wrong thicknesses to determine the reservoir quality sand or to prepare net pay maps for volumetric calculations. Errors of 20 to 30 percent are not uncommon, but on occasion errors of up to 700 percent have been documented.
In one field evaluation, the proved producing and proved reserves behind pipe were reduced from an overestimated value to 150MM barrels of oil to 35MM barrels of oil. Most of the overestimation of oil was the result of using the wrong log thickness to count net sand, net pay and generate net pay isochore maps for volumetric calculations. If we consider an average price for oil of $50 per barrel, the reduction in reserves in this example would result in a future write down of about $5.25 billion. This is no small amount of money!!!!
From evaluating fields to buy in a data room, to determining whether or not to participate in a prospect; from calculating the reserves for a new discovery, to conducting a study on a mature field to identify upside potential, the bottom line is how much oil or gas is recoverable and what is my return on investment. If the wrong numbers are used for the reserves calculations because of an error in the pay thicknesses used for volumetrics, your economic analysis might be worthless.