In an economic environment of constrained exploration and development budgets, surface geochemical techniques are often one of the tools of choice. Welcome to an interview with Rick Schrynemeeckers of Amplified Geochemical Imaging, who talks to us today about how and why hydrocarbon detection using surface geochemical methods has become so valuable.
What is your name and your relation to the oil industry?
My name is Rick Schrynemeeckers and I am the Business Development Manager for North America for Amplified Geochemical Imaging. Amplified Geochemical Imaging performs ultrasensitive hydrocarbon detection both at the surface and downhole.
What are the basic principles behind surface geochemistry?

AGI installation pictures
Scientists have used surface geochemical techniques since 1930 to explore for hydrocarbons. These techniques look for the effects of minute levels of hydrocarbons that leak through imperfect seals and migrate either as macroseepage via faults or as microseepage vertically through reservoir overburden (Klusman, 1993, Coleman et. al. 1997, Anderson, 2006). As most of us know, the term Macroseepage refers to visible oil and gas seeps. Macroseeps are very localized areas containing large concentrations of hydrocarbons that are restricted to the termination of faults, fractures, and outcropping unconformities or carrier beds. These visible seeps have led to the discovery of many of the world's important oil and gas producing areas (Link, 1952; Macgregor, 1993).
In Microseepage, hydrocarbon compounds pervade the overlying seal and migrate vertically through the stratigraphic sequence to the surface. The leakage is not massive, as with a breach of a structural closure. This process is distinct from the movement of hydrocarbons along breaching faults or fracture swarms (i.e. macroseepage), with its consequent surface expression of an oil or gas seep (Silliman, 2005). Due to vapor pressure limitations, typically only volatile or semivolatile hydrocarbons up to C20 are expected above the water table. The existence of microseepage is supported by a large body of empirical evidence (Price, 1986; Klusman, 1993; Klusman and Saeed, 1996; Matthews, 1996).
Why and where does surface geochemistry work best?
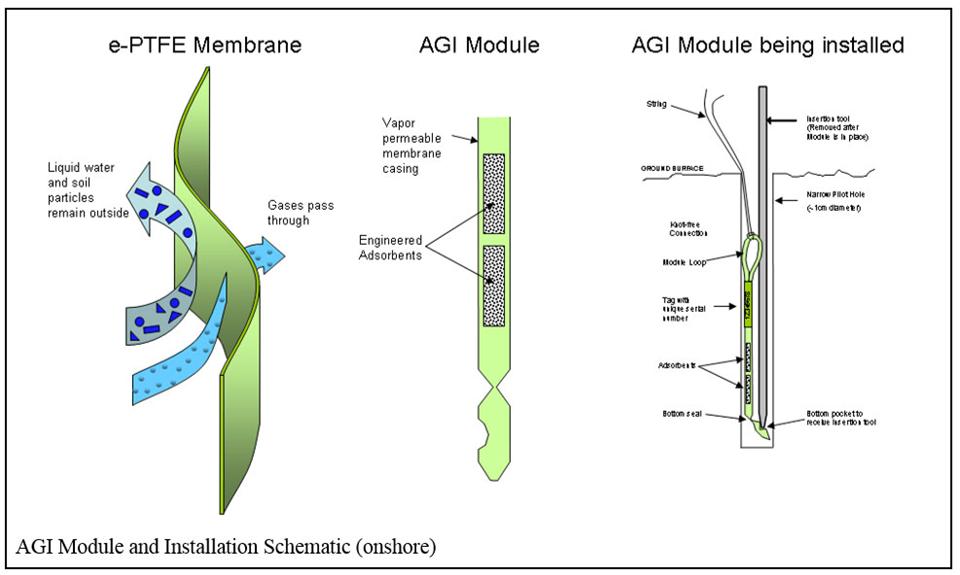
AGI module installation schematic
Obviously every exploration tool, whether it be 2D seismic, 3D seismic, microseismic, basin modeling, or geochemical surveys, needs to be evaluated and incorporated within a full suite of G&G data. However, with that being said, ultimately companies are looking for hydrocarbons, not structures. Consequently, surface geochemistry can help to dramatically derisk exploration and field development efforts. Surface geochemistry can be used to address:
- the presence or absence of a petroleum system thus reducing the probability of spending millions of dollars on dry wells
- the possibility of multiple petroleum systems thus bringing new understanding and economics to fields
- is your hydrocarbon charge gas, condensate, or oil, thereby reducing risk. If a survey only shows the presence of gas, the owner may decide not to drill a well thereby saving millions of dollars
- where are your areas of better pressure, porosity, and net pay thickness (i.e. Sweet Spots in the field with better potential economics)
- potential charge and faulting in areas where seismic insight might be limited (e.g. areas with extensive thrusting, faulting, or thick salt sequences)
What are other technologies that directly detect hydrocarbons? How can they save time and money? How accurate are they?
Early methodologies included soil analysis, soil gas analysis, iodine mapping, and microbial counting. These early methods were often unreliable and disappointing, due to several factors:
- An inability of the sampling method to cope with heterogeneous soil characteristics such as permeability, moisture, and organic content
- Heavy losses in compounds due to poor sampling techniques (Hewitt and Lukash, 1996)
- Monitoring indirect and unreliable proxies (e.g. microbes, iodine) rather than direct hydrocarbon measurements
- Poor sensitivity (parts per million vs parts per billion)
- Severely limited compound ranges (e.g. only C1 – C5)
- Failure to use statistical tools to differentiate between thermogenic and background signatures
What are some pitfalls?
- One must remember that the microseepage expression at the surface is the sum of all the hydrocarbon emitted from the various reservoirs below. Thus, ultrasensitive surface geochemistry works best in those environments where you may have one or more charged zones with different or distinct hydrocarbon phases. Ultrasensitive surface geochemistry can resolve multiple phase signatures (e.g. gas, condensate or oil – as well as multiple oil or gas signatures) as long as there are distinct differences between the hydrocarbon fingerprints. However, in those areas where you have multiple stacked pay with similar signatures that becomes very difficult. Additionally in those areas where you may have two different reservoirs that overlie each other across the entire field, it becomes difficult to differentiate those signatures.
- It is important to remember that reservoir pressure initiates microseepage by driving the hydrocarbons in gas phase through the reservoir seal. The stronger the reservoir pressure the stronger the microseepage signal at the surface. However, the opposite is also true. The lower the reservoir pressure the weaker the signal. So, in depleted reservoirs it becomes difficult, if not impossible at times, to differentiate a depleted reservoir signal from background signal.
- The spacing between modules at the surface is critical. In frontier areas, the spacing is normally 2 km – 3 km because the objective of the survey is to simply identify the possible presence of a petroleum system. For prospect ranking where the objective is to not only to define the hydrocarbon phase, but also the boundaries of the petroleum accumulation, tighter spacing of ~500 m is more appropriate. If the objective is to map channel sands the appropriate spacing is more likely to be ~150 m – 250 m. So, the objective of the survey and the geology (i.e. thrusting, faulting, sealing faults, etc.) have a significant impact on sampling density and project success.
What do you see as the next step-change in the technology?
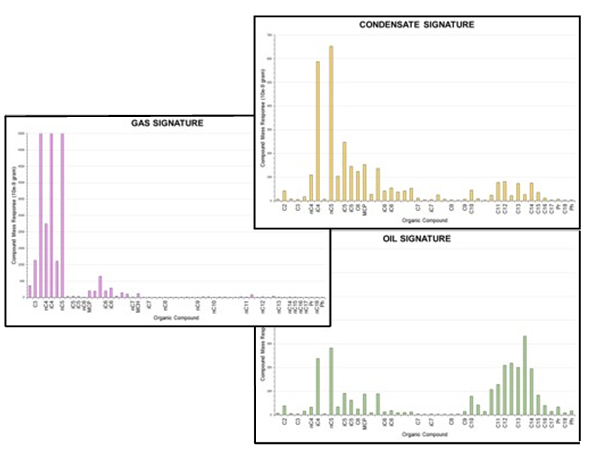
Hydrocarbon signatures borders
Probably the most exciting research that is going on right now is combining ultrasensitive passive geochemical sorbers with seismic Ocean Bottom Nodes (OBNs). Onshore passive nodes are typically left in the ground for ~3 weeks for equilibration and concentration of hydrocarbons to reach parts-per-billion level detection. However, for offshore campaigns piston core samples are collected and then the geochemical data is elucidated from those piston cores.
Research is going on in which passive ultrasensitive geochemical modules are attached to OBNs, both of which are typically left in tandem for ~4 weeks on the seabed floor. The tremendous benefit would be the ability to generate high resolution seismic data while simultaneously collecting high resolution hydrocarbon data ranging from C2 – C20. Since these ONB campaigns are typically performed over multiple intervals over several years, the hydrocarbon data could potentially be used to identify:
- Which structures across the field are charged or uncharged
- By-passed pay
- Hydrocarbon movement from EOR efforts
- Sealing faults
- Production and depletion affects
******
Don't Miss: AAPG Making Money with Mature Fields / October 5-6, 2017 / Houston, TX