Everyone has heard of a bright spot – a high seismic amplitude caused by hydrocarbon. Much oil and gas has been found by drilling anomalous bright reflections, particularly in younger sediments.
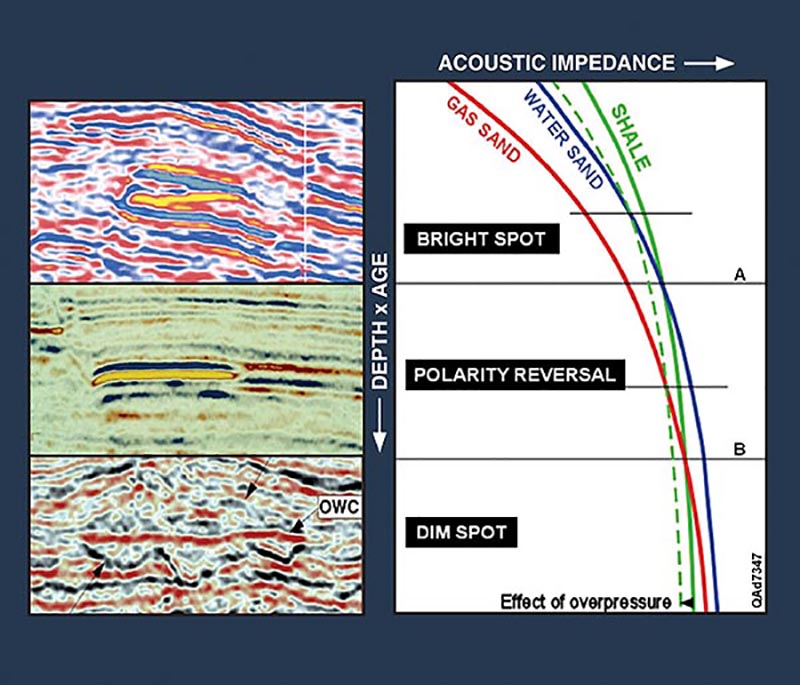
Figure 1 – (Right) Generalized curves showing how the acoustic impedances of gas sands, water sands and shales increase with depth. Bright spots occur above depth A, where there is a large contrast in shale and gas-sand impedances but a modest difference between shale and water-sand impedances. Polarity reversals occur between depths A and B, where water-sand impedance is greater than shale impedance but gas-sand impedance is less than shale impedance. Dim spots occur below depth B, where the three impedance curves converge and there are only small impedance contrasts between shale and either type of sand, brine-filled or gas-filled. (Left) Examples of seismic reflectivity for each of the three sand/shale impedance regimes, taken from AAPG Memoir 42 (sixth edition).
Everyone has heard of a bright spot – a high seismic amplitude caused by hydrocarbon. Much oil and gas has been found by drilling anomalous bright reflections, particularly in younger sediments.
But how many explorationists have found hydrocarbon with dim spots – a reduction in amplitude caused by hydrocarbon?
When water in a porous rock is replaced by hydrocarbon, the acoustic impedance (the product of density and velocity) of the rock universally reduces in magnitude. The effect diminishes with depth, but the change is always in the same direction – a decrease in impedance.
The observed seismic phenomenon depends on the impedance of the reservoir, and on the magnitude of the impedance change, relative to the impedance of the embedding rock.
Compaction of sand and shale causes their acoustic impedances to increase with depth and age (figure 1), but these impedances normally increase at different rates. For young, shallow clastic rocks, sands typically have lower impedance than shales – but for older, deeper clastic rocks, sands typically have higher impedance than shales.
Note the crossover of the shale impedance and sand impedance curves on the figure.
When a water sand has lower impedance than its embedding shale, changing the water in the pores to hydrocarbon increases the sand-shale impedance contrast and thus increases seismic reflection amplitude, which results in a bright spot.
When a water sand or other reservoir rock has higher impedance than its embedding shale, replacing the water in the pores with hydrocarbon decreases the impedance contrast, and the result is a dim spot.
The figure shows normal compaction curves for one local area. Because these are trends generally applicable to many areas, no numbers are assigned to the axes. The crossovers of the curves cause the phenomena bright spot, polarity reversal and dim spot to occur in this ordered sequence with increasing depth. Thus, once an interpreter has established one seismic hydrocarbon indicator (say, polarity reversal), this depth-dependent trend provides a valuable guideline for the nature of the hydrocarbon indicator that should be expected at a deeper or shallower target.
Notice on the figure there is a data example illustrating each of the seismic reflection phenomena. The dim spot example illustrates a strong oil-water contact reflection, but the reflection from the top of the oil sand is low amplitude and difficult to see because it is a dim spot.
The above argument means that dim spots occur deeper than bright spots, but they are a well-understood and valid type of seismic reflection phenomenon. Some hydrocarbon has been found with dim spots, and some hydrocarbon fields have been developed using dim spot phenomena. Thus we must recognize the existence of dim spots and start looking for more of them!
As we do so, however, we must realize that dim spots are difficult to recognize and to apply because:
- Deeper seismic data have poorer resolution.
- Deeper seismic data often have a lower signal-to-noise ratio.
- It is more difficult to be confident of an interpretation involving reduced amplitude than an interpretation involving increased amplitude because more ambiguities are involved in low-amplitude data.
An interpreter must consider all the characteristics of hydrocarbon reflections, not just dimness (or brightness), and in AAPG Memoir 42 (sixth edition) the author lists 17 characteristics observable on seismic data that are properly displayed on a workstation. In addition there are special techniques like AVO and converted waves that provide additional evidence.
We all know that the easiest oil and gas has been found and that future exploration challenges must involve innovative technological applications and smarter explorationists. Dim spots are thus an opportunity of the future, and the emerging generation of geoscientists should accept the challenge.
The future of direct observation of hydrocarbons may be dim indeed!