The North Sea is one place where new approaches to older challenges are constantly sought. The new technique called “frequency blend” applies color to help visualize frequency bands and is working well in the Barents Sea.
Who said getting older had to be a bad thing?
Not with the continuously advancing high tech world of exploration still finding newer approaches to familiar challenges.
And not when explorationists and their companies willingly embrace the technological advances that are proving to be valuable tools.
A specific example can be found in the maturing North Sea, where companies continue to look for better ways to exploit known resources – or to seek new discoveries, or to explore in frontier areas such as the Barents Sea off Norway’s northern coast.
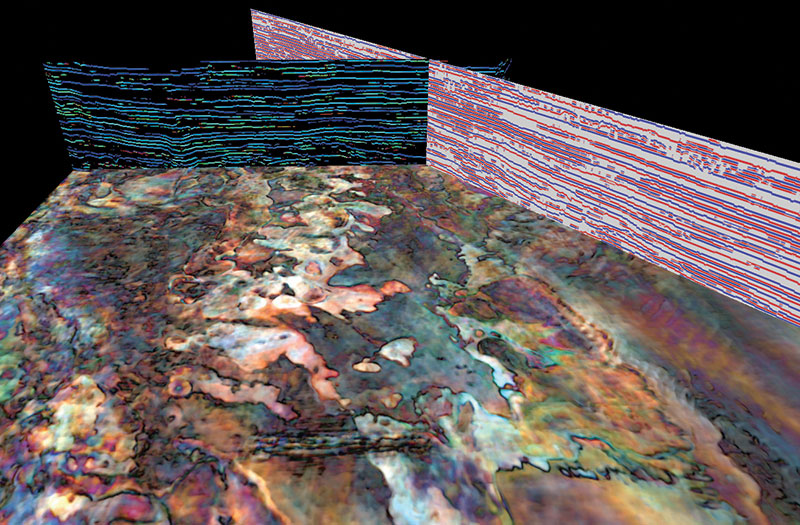
Using colors to provide geoscientists with a new tool for trap and reservoir prediction: RGB frequency blend reveals casrbonate reef geometries. Graphics courtesy of ffA GeoTeric
In the North Sea, “the simple four-way closures and rotated fault blocks are all drilled. The exploration target increasingly turns into stratigraphic traps with increased need for depositional control,” said Trond Kristensen, geophysicist with independent Swedish oil and gas exploration and production company Lundin Petroleum.
Lundin has been deeply involved with the huge Johan Sverdrup and Edvard Grieg discoveries – and Kristensen said continuous learning is the key to Lundin’s success.
“We always have time to listen to new or old companies with new ideas for the industry,” he said.
“And once in a while something very good appears,” Kristensen continued, “a new technique to look at fluid inclusions in cores, a new way of collecting seismic data, a new seismic processing algorithm, a new logging tool and so on.”
On the Job
One helpful new method Kristensen specifically cites came from ffA’s GeoTeric software and its “frequency blend” technique.
“The Holy Grail for an oil explorer is to convert seismic data into the dynamic depositional environment existing at the time of the seismic reflectors,” Kristensen said. “Understanding the ancient landscapes will help predict where to find reservoirs and traps.”
The “frequency blend” technique involves using advanced color visualization to simultaneously examine the seismic response within different frequency bands.
“We believe that the increased geological understanding provided by the frequency blend gives valuable information for trap definition and reservoir prediction,” he continued. “Not all areas are as well-suited as others for this technique, but the new HDFD shows promise in hereto difficult situations.”
(HDFD stands for “High Definition Frequency Decomposition,” which has been developed to enable clearer isolation of features in their true depositional layers.)
Although the software wasn’t used on the initial Edvard Grieg work, it since has been used on both the Grieg and more recent Johan Sverdrup discoveries.
“They share the same challenge regarding detailed reservoir predictions,” Kristensen said.
“Otherwise, in exploration we have found the Barents Sea to be especially suitable for the frequency blend technique, showing beautiful depositional environments,” he said. “This has been very helpful in the concession rounds in this area.”
The displays also are great for communicating ideas, he added.
“You could spend a long time discussing small amplitude anomalies on the seismic, but when you can pull out a picture ... the discussion can be much more constructive and to the point,” Kristensen said. “Some of this is also possible on more conventional attribute processing, but they are more difficult to define, and lack the almost picture-like clarity of the frequency blend.”
Subject to Interpretation
The Adaptive Geobodies technology has been developed jointly by ffA and Lundin to “extract geological elements even when their expression is subtle or highly variable. It works by adapting the criteria for defining a specific object much in the way that the human visual system does,” said Gaynor Paton, ffA’s director of geosciences.
In addition, she said because it recognizes that seismic data is an incomplete representation of the subsurface, the interpreter is free to step in and guide the delineation process when the data isn’t enough on its own.
With this data driven-interpreter guided approach it is possible to extract 3-D geobodies, she said, representing features such as braided channel or karst systems, where it would have been impossible previously.
“To counter-balance the subjectivity introduced when a data driven process is overridden by manual intervention, objects defined in this way are assigned a confidence value that indicates how well the surface position respects the underlying data,” she said.
“This shows where the interpretation is data-constrained,” she added, “and where it is defined by the expertise of the geologist or geophysicist.”
Color My World
The industry’s “huge reliance on seismic data” has naturally led to an enormous investment in acquiring more data and improving the quality of seismic acquisition and processing systems – but “to maximize the value we can obtain from this investment we need to see similar advances in techniques for interpreting seismic data,” said Jon Henderson, ffA’s managing director.
“Advancing seismic interpretation needs to be tackled from two directions,” he continued. “One of these is improving quantification and is geophysics/rock physics led; the other is to make certain aspects of interpretation more geologically led.
“This means converting seismic data into geological images.”
A good analog for this approach, he said, can be found in medical imaging, where the key to successful diagnosis is to present the image information to a clinical specialist in a manner that enables them to understand the anatomical or physiological changes caused by the disease or trauma.
One of the keys to this “geological expression” approach is to present multiple aspects of the seismic response (attributes) using sophisticated 3-D visualization techniques – as illustrated by the “frequency blends” described by Lundin.
Combining multiple attributes makes the most of the human eye’s ability to perceive color – it can discriminate about 10 million different colors compared to just 500 shades of grey.
“If we combine images in the correct way, the information content of the combination can be many times higher than just the sum of the information contained in each of the inputs,” he said.
Combining these factors together makes it possible to see clearly geological features that are associated with only very subtle changes in seismic response – a critical dynamic in the quest to identify new opportunities in mature areas and for understanding reservoir complexity.
“While converting geophysical data into geological images is a great way of increasing and communicating knowledge and geological understanding, it is also important to be able to delineate and measure the geological elements that are revealed,” Henderson said. “This is where understanding how we perceive image data has a major impact. While the human interpreter can usually outperform even the most sophisticated image analysis system in tasks centered round feature recognition, we are much less adept if asked to accurately measure the features that we see.
“On top of this,” he continued, “seismic data provides a noisy, incomplete and often ambiguous representation of the subsurface.
“Without the expertise and knowledge of the interpreter it would be very difficult and in some cases impossible to resolve these ambiguities,” he added.
“What we need to explore in developing new interpretation technologies is not replacing the geological insight brought by the interpreter, but ways of utilizing this insight simultaneously with objective mathematical analysis,” Henderson said.
It’s what he calls “bringing together the art and the science of interpretation.”