The learning curve: Getting small independent producers to embrace 3-D seismic was a process that depended as much on education as on success.
When I joined the Bureau of Economic Geology in 1991, one of the first assignments I took on was to implement a series of workshops that focused on transferring 3-D seismic technology to small independent U.S. producers.
To non-U.S. readers, the concept of the U.S. small-producer community is probably strange, but these companies are the backbone of U.S. onshore oil and gas production.
It is difficult to know how many independent oil and gas producers exist across the United States, but the number is thought to be more than 6,000. Most of these companies have modest technical staffs.
In the Bureau’s 3-D seismic education campaign we did a demographics study to determine the staff organization of a typical small U.S. independent. We found that, on average, an independent had 2.3 employees, and that the areas of expertise practiced by this staff were, in order of occurrence:
- Engineering – Almost every company had an engineer.
- Land and Legal – Almost every company had someone who specialized in land deals and who took care of legal matters.
- Geologist – Surprisingly, many small independents did not have a geologist on staff but used geological consultants.
- Geophysicist – A geophysicist was rarely found on a company’s staff. Small independents relied almost totally on seismic contractors and consultants for their geophysical support and advice.
Other important facts we found were that the drilling targets of small independents were almost always some type of stratigraphic trap, and that (in 1991–1992) few independents used or understood 3-D seismic technology.
The Learning Curve
Because banking and financial institutions were beginning to insist that an oil and gas prospect had to be evaluated with 3-D seismic imaging before they would provide money for exploitation, most of the 600-plus independents who attended the 3-D seismic workshops (taught at more than 15 locations across Texas, New Mexico, Oklahoma and Kansas) were eager to learn how to integrate 3-D seismic activity into their operations.
The cornerstone of the educational workshop at each venue was a small two-square mile 3-D seismic survey covering a property where the drilling target was a channelized stratigraphic trap – participants from the small companies who attended these workshops identified with this property size and with this type of drilling target.
Vertical seismic profile (VSP) data were acquired in a well inside the 3-D image area to define where thin-bed targets – known only as a function of depth from well control – should be positioned in 3-D seismic image space.
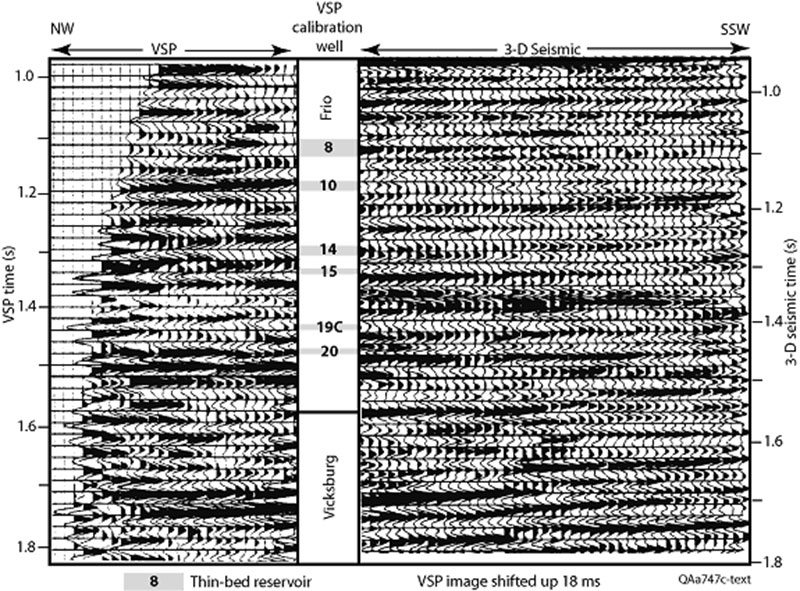
Figure 1 – VSP data acquired in a calibration well showing where thin-bed units, known as a function of depth from logging control, appear in VSP and 3-D seismic image time. The thin-bed units are welded to the VSP image and move up and down in 3-D seismic image space as an interpreter moves the VSP image and decides how to optimally correlate it with the 3-D image. In this instance, the interpreter decided the best correlation resulted when the VSP image was shifted up by 18 ms relative to the 3-D image. The targeted reservoir is the 19C unit, a narrow meander channel.
The principal thin-bed reservoirs penetrated by this calibration well are labeled on the data displayed as figure 1.
One of the key thin-bed targets at this prospect was the unit labeled 19C, so the case history portion of the workshop focused on using 3-D seismic technology to develop a strategy to exploit this thin-bed channel reservoir.
The VSP data were used to define the position of the 19C reservoir in the 3-D seismic volume. A stratal surface passing through the 19C thin bed at the VSP calibration well, and then extended across 3-D image space, is shown by the deeper horizon on the display in figure 2.
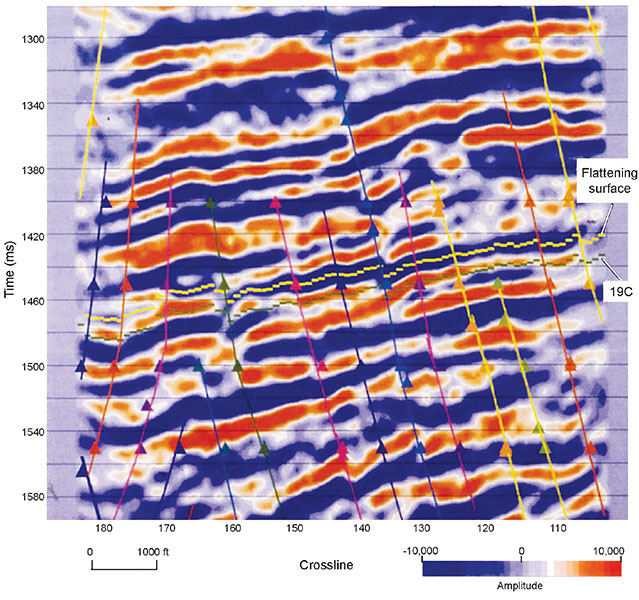
Figure 2– Vertical section through the 3-D seismic volume showing the VSP-defined position of a stratal surface passing through the 19C reservoir and extending across the 3-D volume. The VSP well is not located on this profile. The creation of the flattening surface that was used for time slicing across the 19C reservoir was difficult because numerous faults offset the reflection peak that needed to be interpreted. For example, the reference flattening surface is probably not correctly interpreted at the extreme left side of this profile in the local vicinity of crossline coordinate 180.
At the VSP calibration well, this horizon was conformable to the reflection peak labeled “flattening surface” that immediately bounded it. This reference reflection peak could be interpreted across the complete 3-D volume.
A reliable map of the reflection amplitude behavior across the complete 19C stratal surface was constructed (figure 3) by first flattening the 3-D volume on this reference surface and then making a time slice through this flattened 3-D volume at an image-time offset defined by the VSP data.
In this instance, reflection amplitude provided an excellent picture of the meandering channel that formed the 19C target.
Today, with coherency volumes and more sophisticated interpretation software, better channel images can be constructed than what we produced almost 20 years ago.
Words to the Wise
Small independents, like many large companies, often get fixated on drilling regularly spaced well patterns to exploit a prospect.
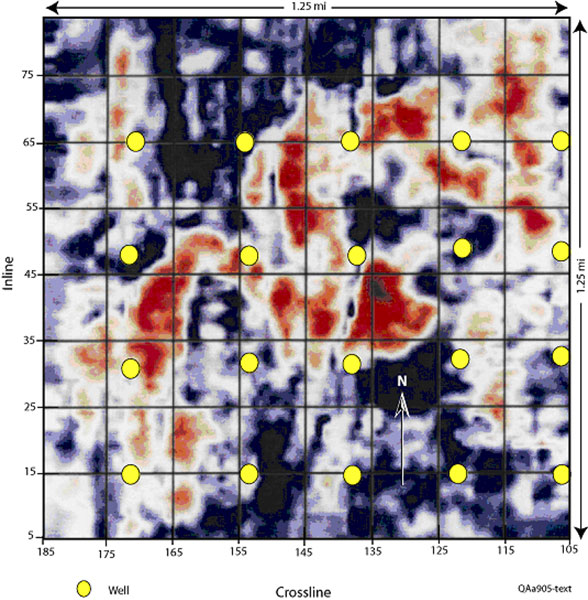
Figure 3 – Reflection amplitude across the stratal surface corresponding to the VSP-defined position of the 19C unit in 3-D seismic image space. The 19C reservoir is the red-color meandering channel feature trending southwest to northeast. A pattern of wells drilled at 40-acre spacing is shown by the yellow dots. None of the 20 wells make optimal contact with the 19C reservoir channel. Smart companies use 3-D seismic images to position wells, drill fewer wells and establish good contacts with the drilling target.
One of the sobering examples developed in this workshop was the superposition of a pattern of 40-acre well spacing atop the 19C channel system (figure 3). Such a well pattern was (and still is?) a common drilling strategy by many companies.
In this hypothetical drilling program, no well made optimal contact with the target. A few wells interacted with the channel just enough to encourage further drilling of the regular well spacing.
Because this one example illustrated how 3-D seismic data allow smarter drilling, it probably convinced more small independents that they had to implement 3-D seismic practice than did any other argument or any other data that were presented at those long-ago workshops.
Maybe this story still has some educational value. If so, use it freely.
Small U.S. independents are now among the most aggressive users of 3-D seismic technology. The data shown here were, in part, the catalyst that started the movement, almost 20 years ago, by many independents to practice 3-D seismic technology.
The education process continues.